Documentation Index
Fetch the complete documentation index at: https://playerzero.ai/docs/llms.txt
Use this file to discover all available pages before exploring further.
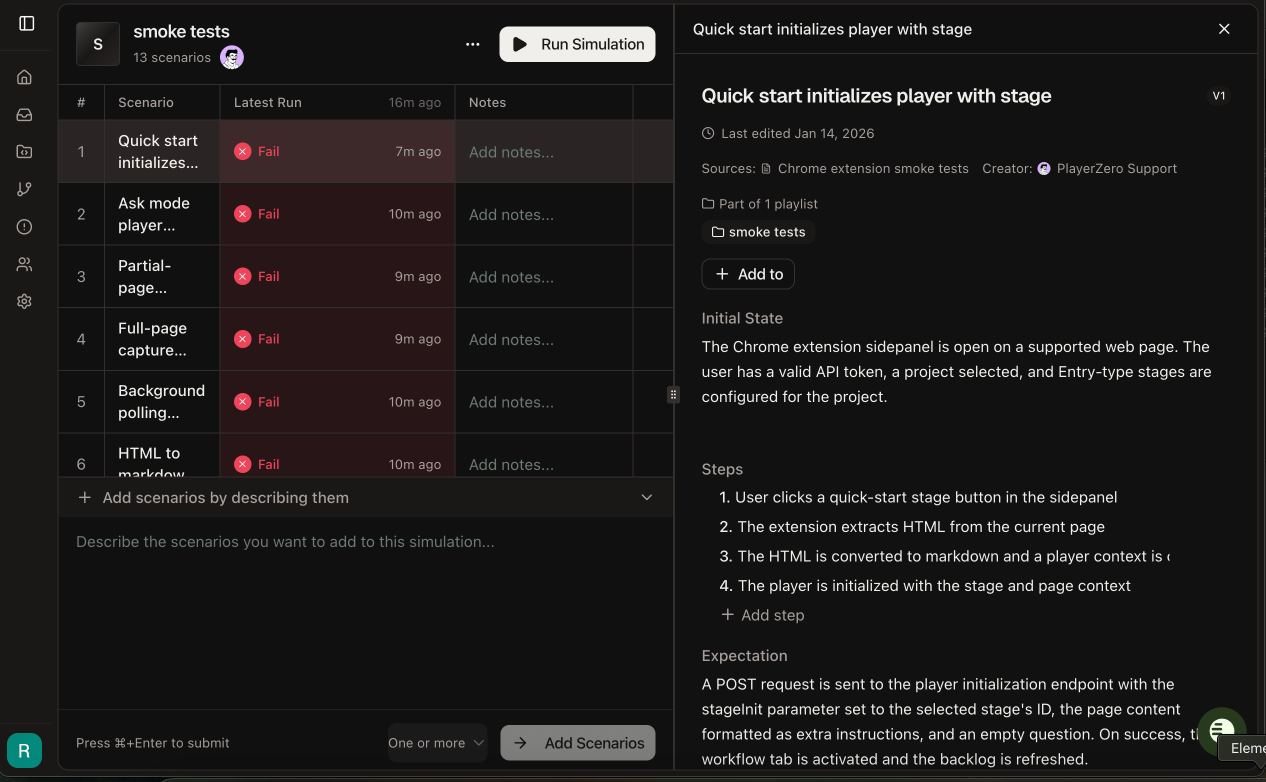
Playlists -> Simulations redesign
We renamed the top-level Playlists page to “Simulations” and redesigned the interface with a two-panel layout. You can now view your scenario collection on the left while reviewing individual code sim results on the right. The new design includes inline scenario management, real-time execution updates, and direct access to review code sim results or edit scenarios directly, without leaving the page. What this means for your teams: QA teams create, edit, and manage comprehensive test suites faster with side-by-side scenario and result views.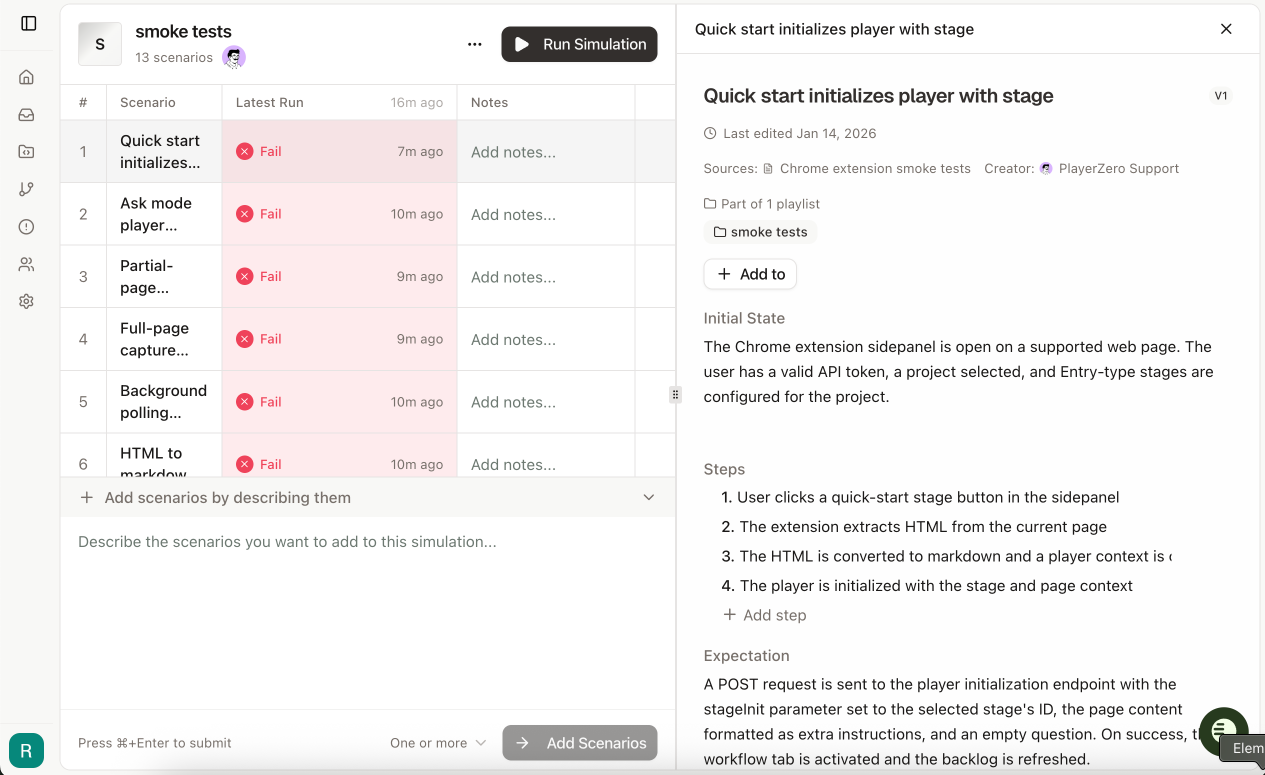
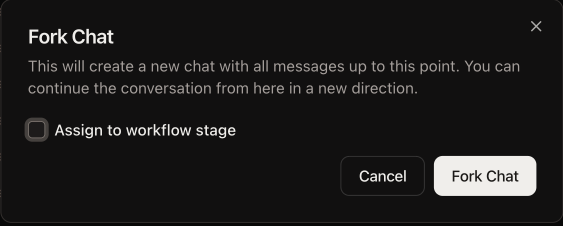
Fork Player Conversations
You can now fork any Player conversation at any message, creating a branched copy that preserves all history up to that point. Fork directly into a specific workflow stage by selecting the stage and adding context notes for the AI. The forked conversation opens in a new tab so you can explore alternative approaches without losing your original investigation. What this means for your teams: Support engineers test multiple resolution paths simultaneously without losing context. Engineering teams hand off partial investigations to specialists by forking directly into the appropriate workflow stage with relevant guidance.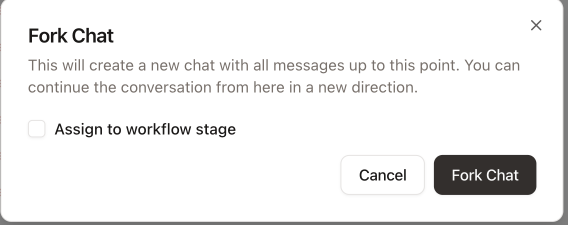
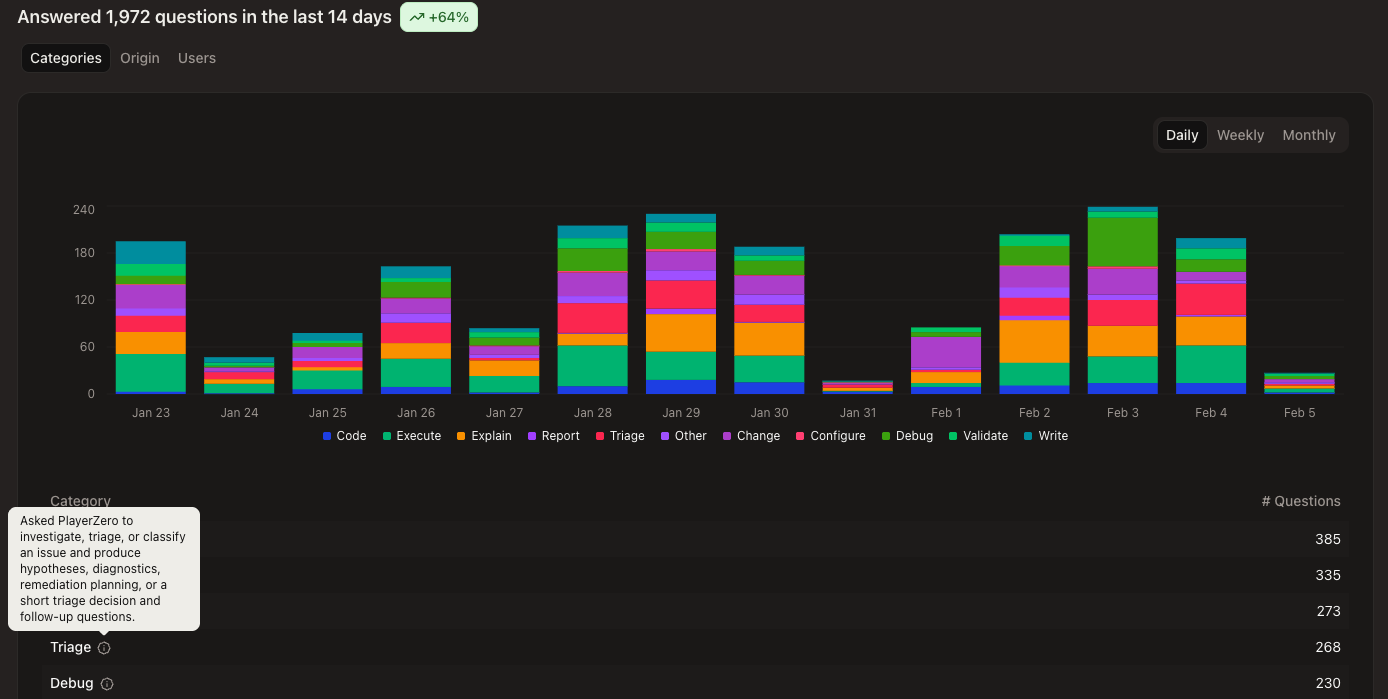
Understand PlayerZero Usage with Question Analytics
We added intent classification to the Usage Analytics page, categorizing every question into types such as Debug, Triage, Explain, Configure, Validate, and more. The Categories tab shows how your team’s questions break down by intent over time to reveal trends in PlayerZero usage. What this means for your teams: Engineering leaders measure how teams actually use PlayerZero to better understand ROI and identify training opportunities. Track trends in whether questions are reactive (mostly Debug and Triage) or proactive (Code and Change) to inform process improvements.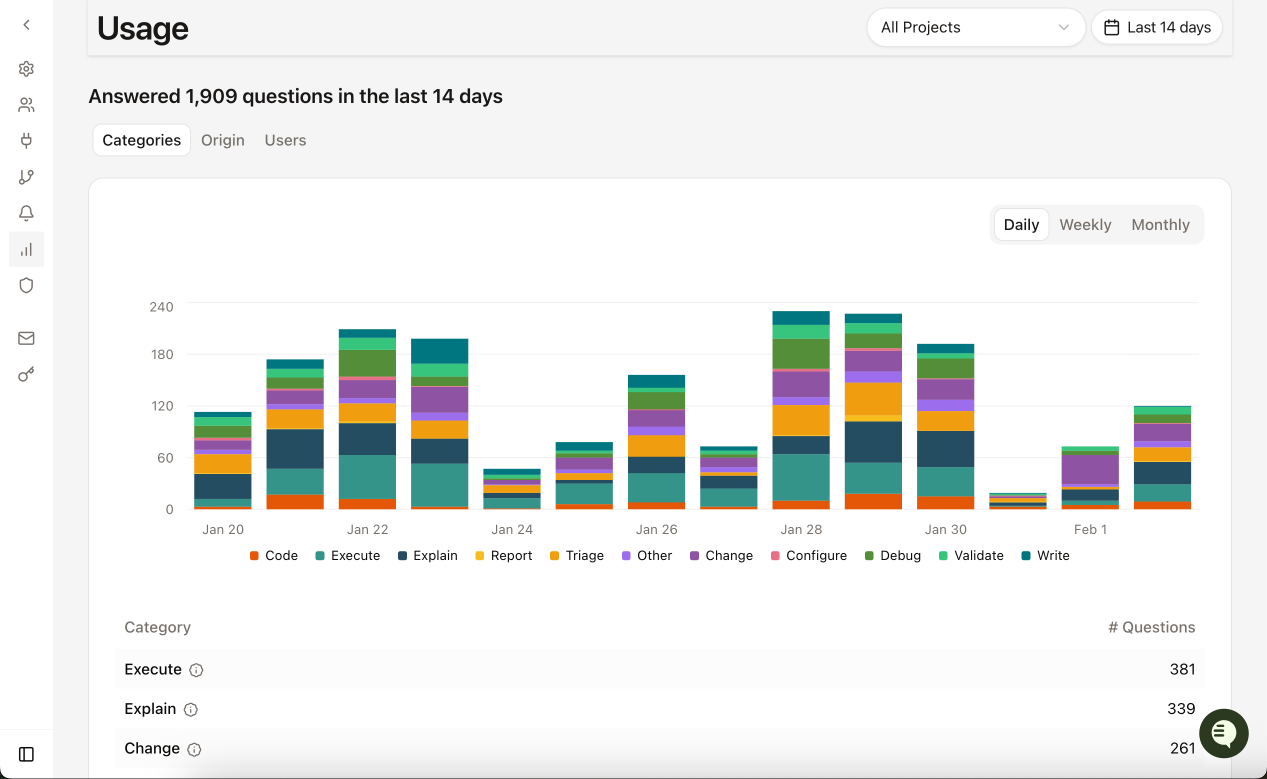
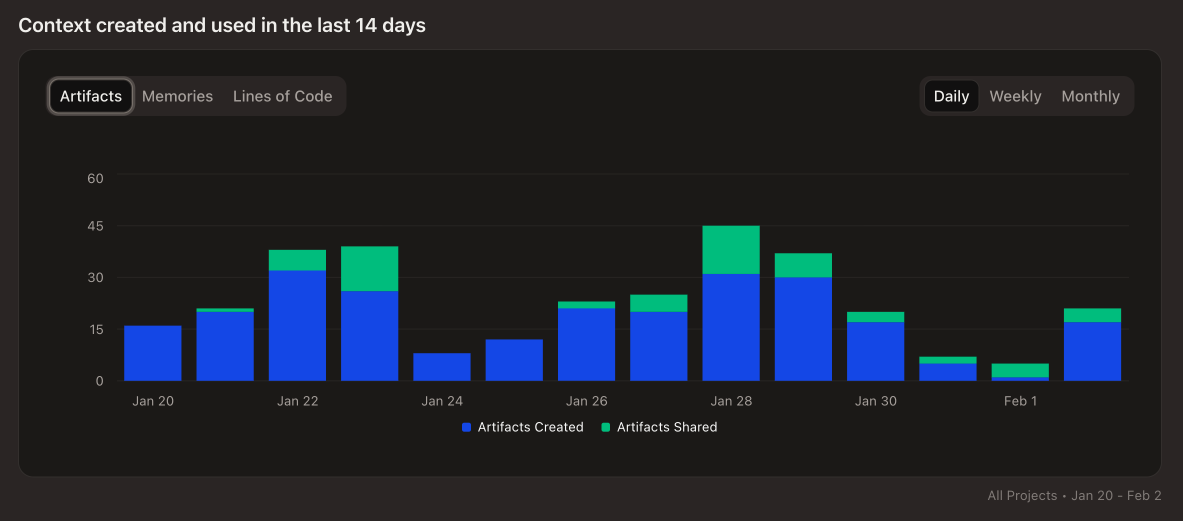
Added Context Usage to Usage Analytics
We added a Context section to Usage Analytics showing how Artifacts, Memories, and Code are created and used within PlayerZero. Each metric includes time-series visualization across your selected date range, letting you track how teams create and leverage AI-powered context. What this means for your teams: Engineering leaders identify high-performing teams building and leveraging institutional knowledge.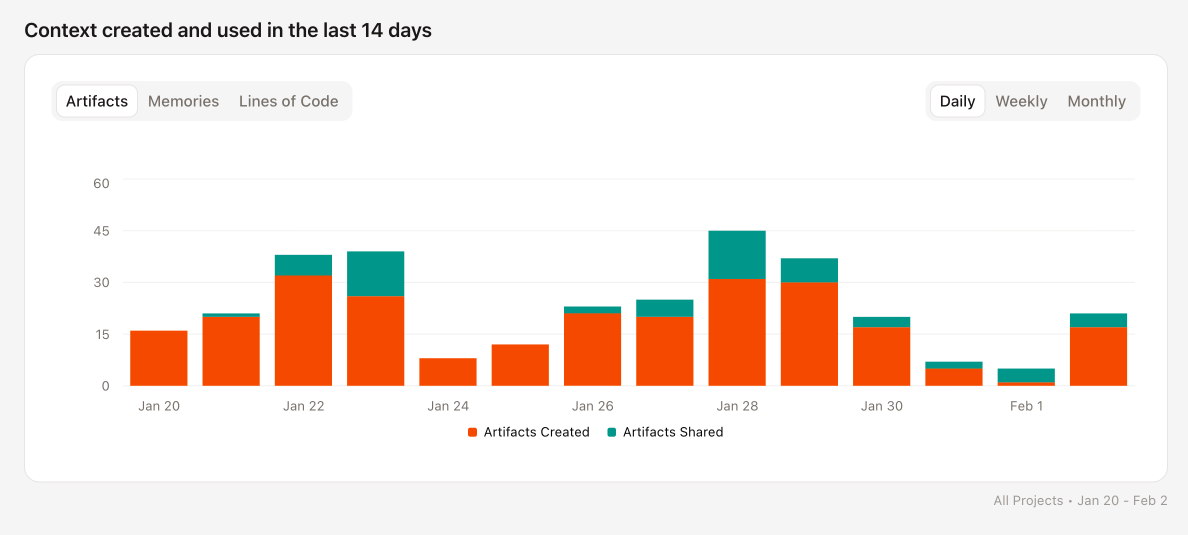
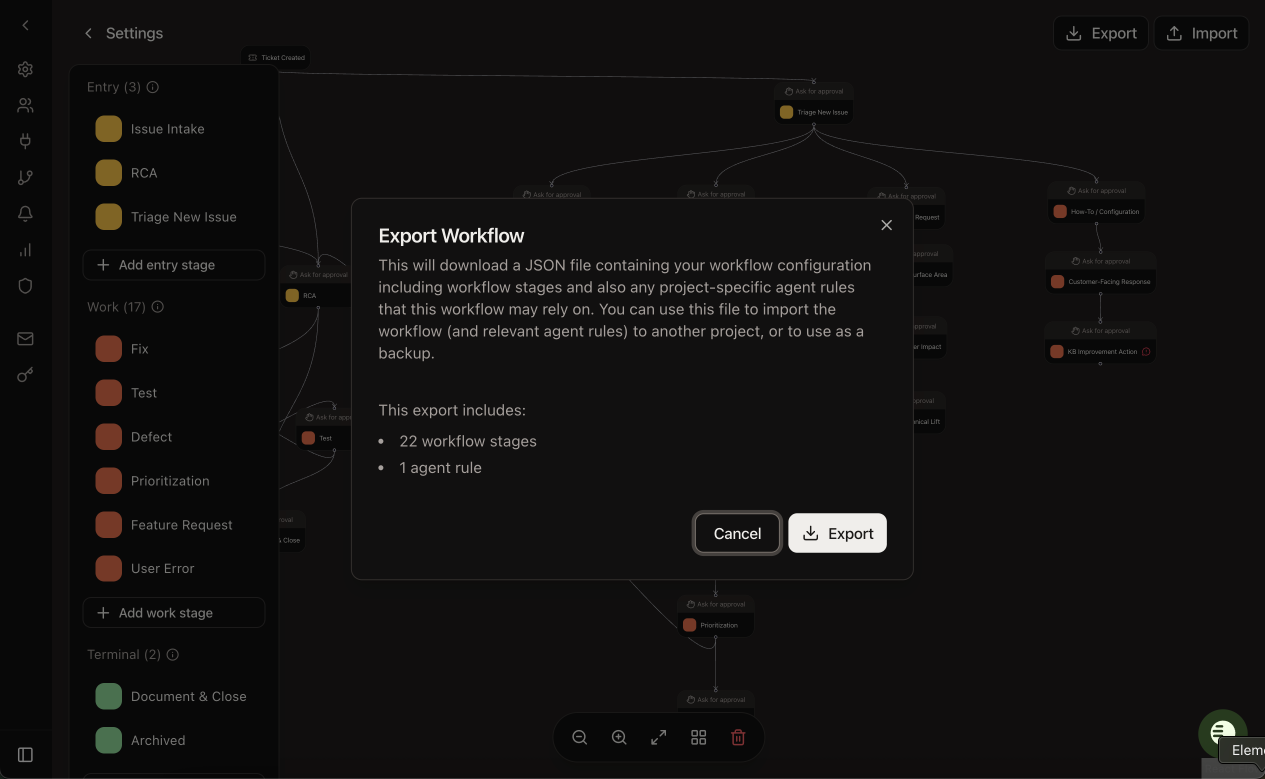
Export and Import Workflow Configurations
Workflow configurations can now be exported as JSON files. Import these configurations into other projects to set up new workflows in a single step. What this means for your teams: Project administrators can onboard new teams faster by importing proven workflow configurations, and teams can back up critical workflow setups for documentation and recovery.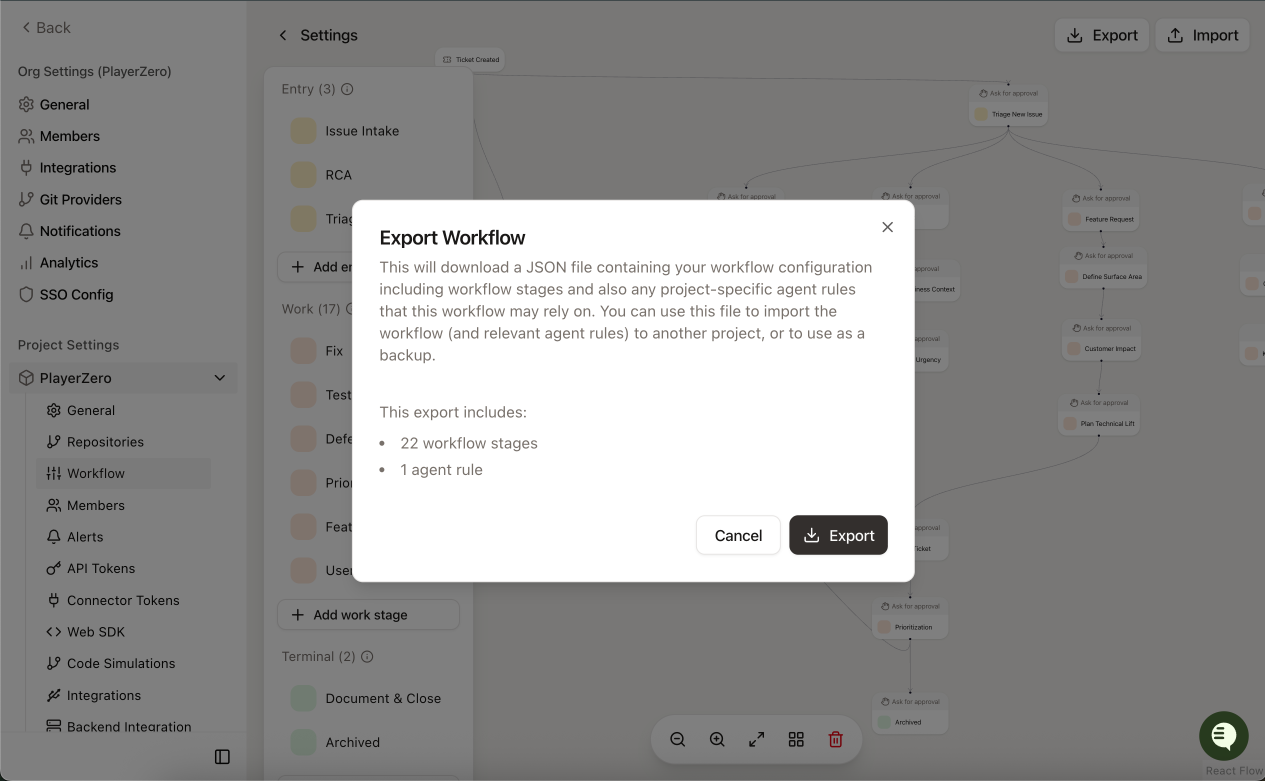
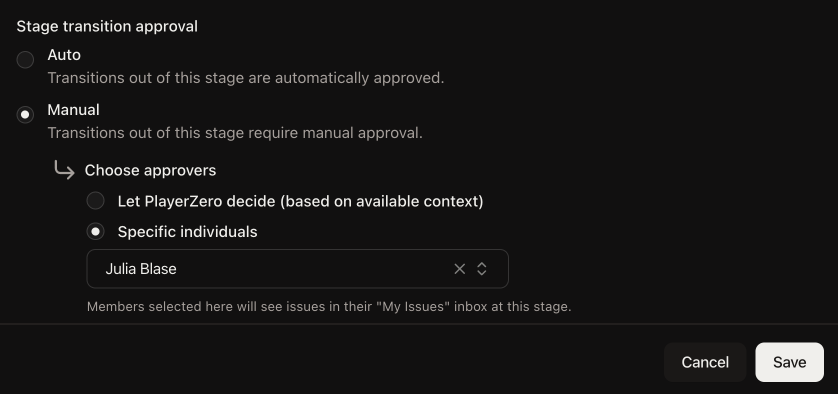
Assign Specific Stage Approvers
Workflow stages now support two approval methods: let PlayerZero suggest approvers based on code ownership, or assign specific team members who will always receive approval requests. What this means for your teams: Workflow admins and Engineering managers ensure critical review stages reach the right specialists regardless of code ownership patterns.