The Technical Infrastructure of Automated Debugging
Unifying system insights for smarter, faster debugging
Engineering leaders today face a growing paradox: ship software faster while reducing defects, all without increasing headcount. The promise of “fully autonomous debugging” may sound like a dream solution, but the reality is far more complex. Debugging isn’t just about pattern recognition; it requires context, systems thinking, and human judgment.
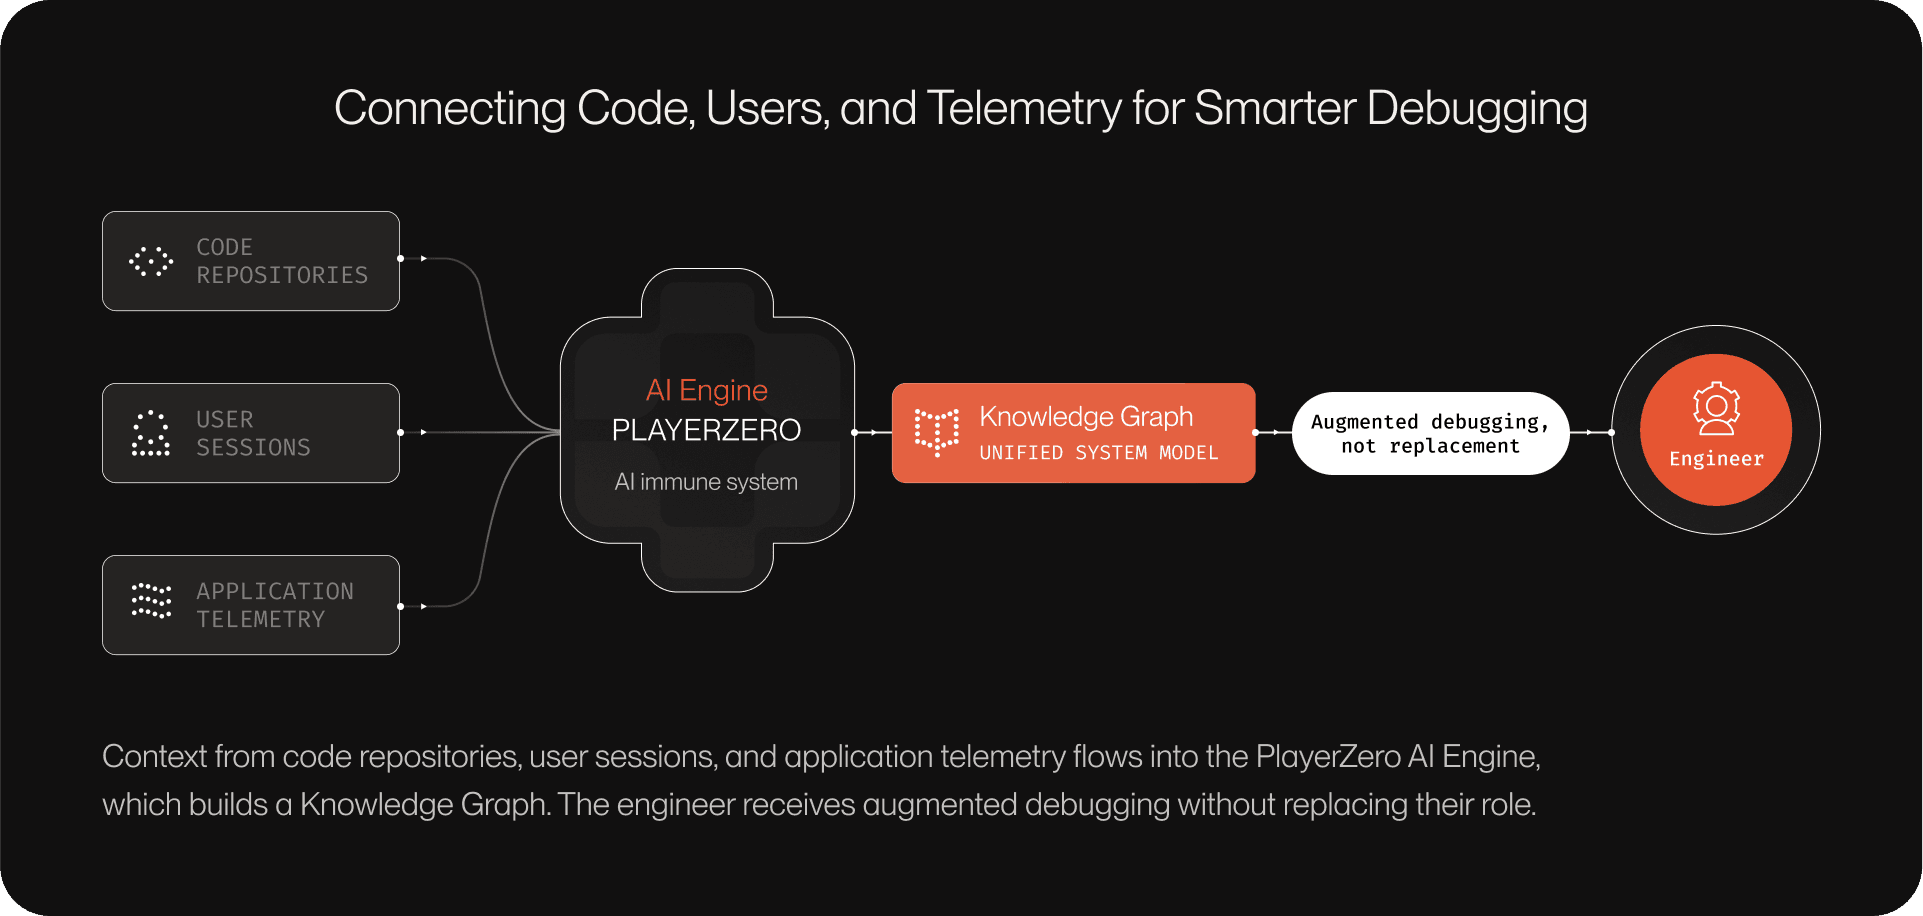
That’s why PlayerZero takes a fundamentally different approach. It functions as an AI immune system for software by continuously monitoring application behavior, identifying anomalies, and proactively defending against recurring defects. It also automates test generation based on user behavior, creating targeted, context-aware tests that reflect how users actually interact with the application.
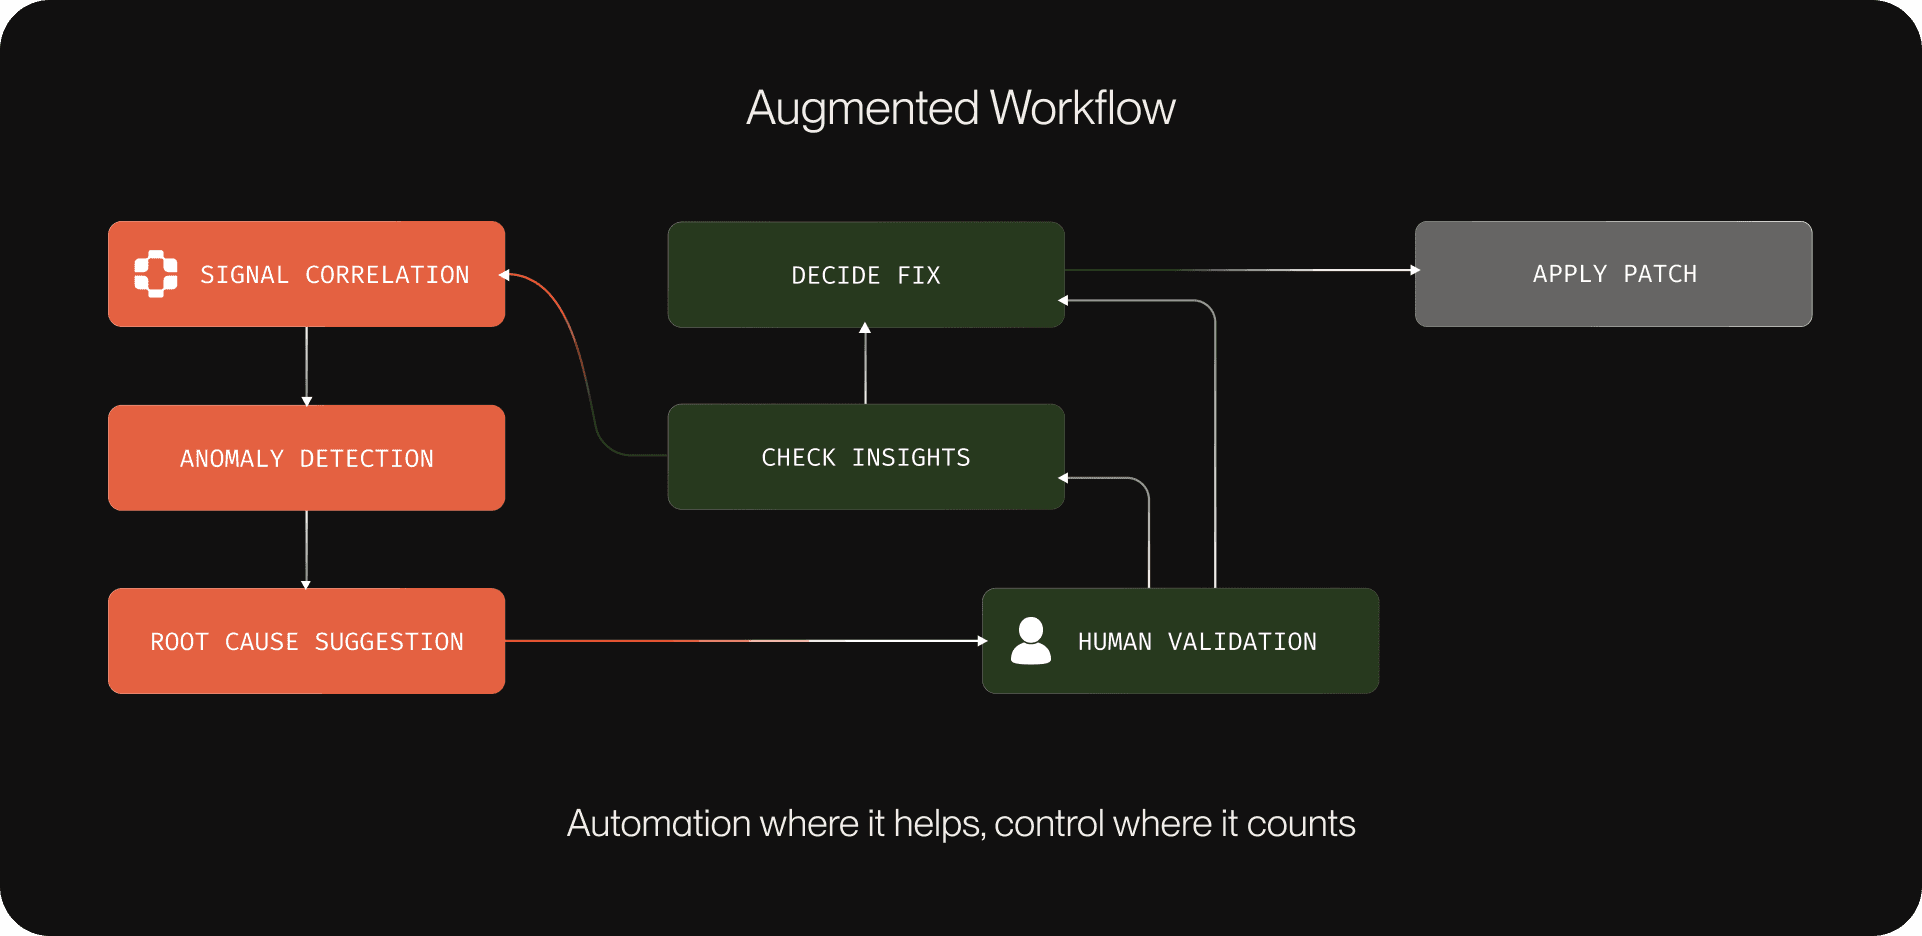
Rather than replacing engineers, it accelerates them. By automating the time-consuming actions of debugging, such as signal correlation, anomaly detection, and root cause suggestion, PlayerZero helps teams work faster without sacrificing insight or control. The result is not autonomy, but augmentation: a human-in-the-loop workflow where engineers remain decision-makers, backed by a powerful layer of intelligent automation.
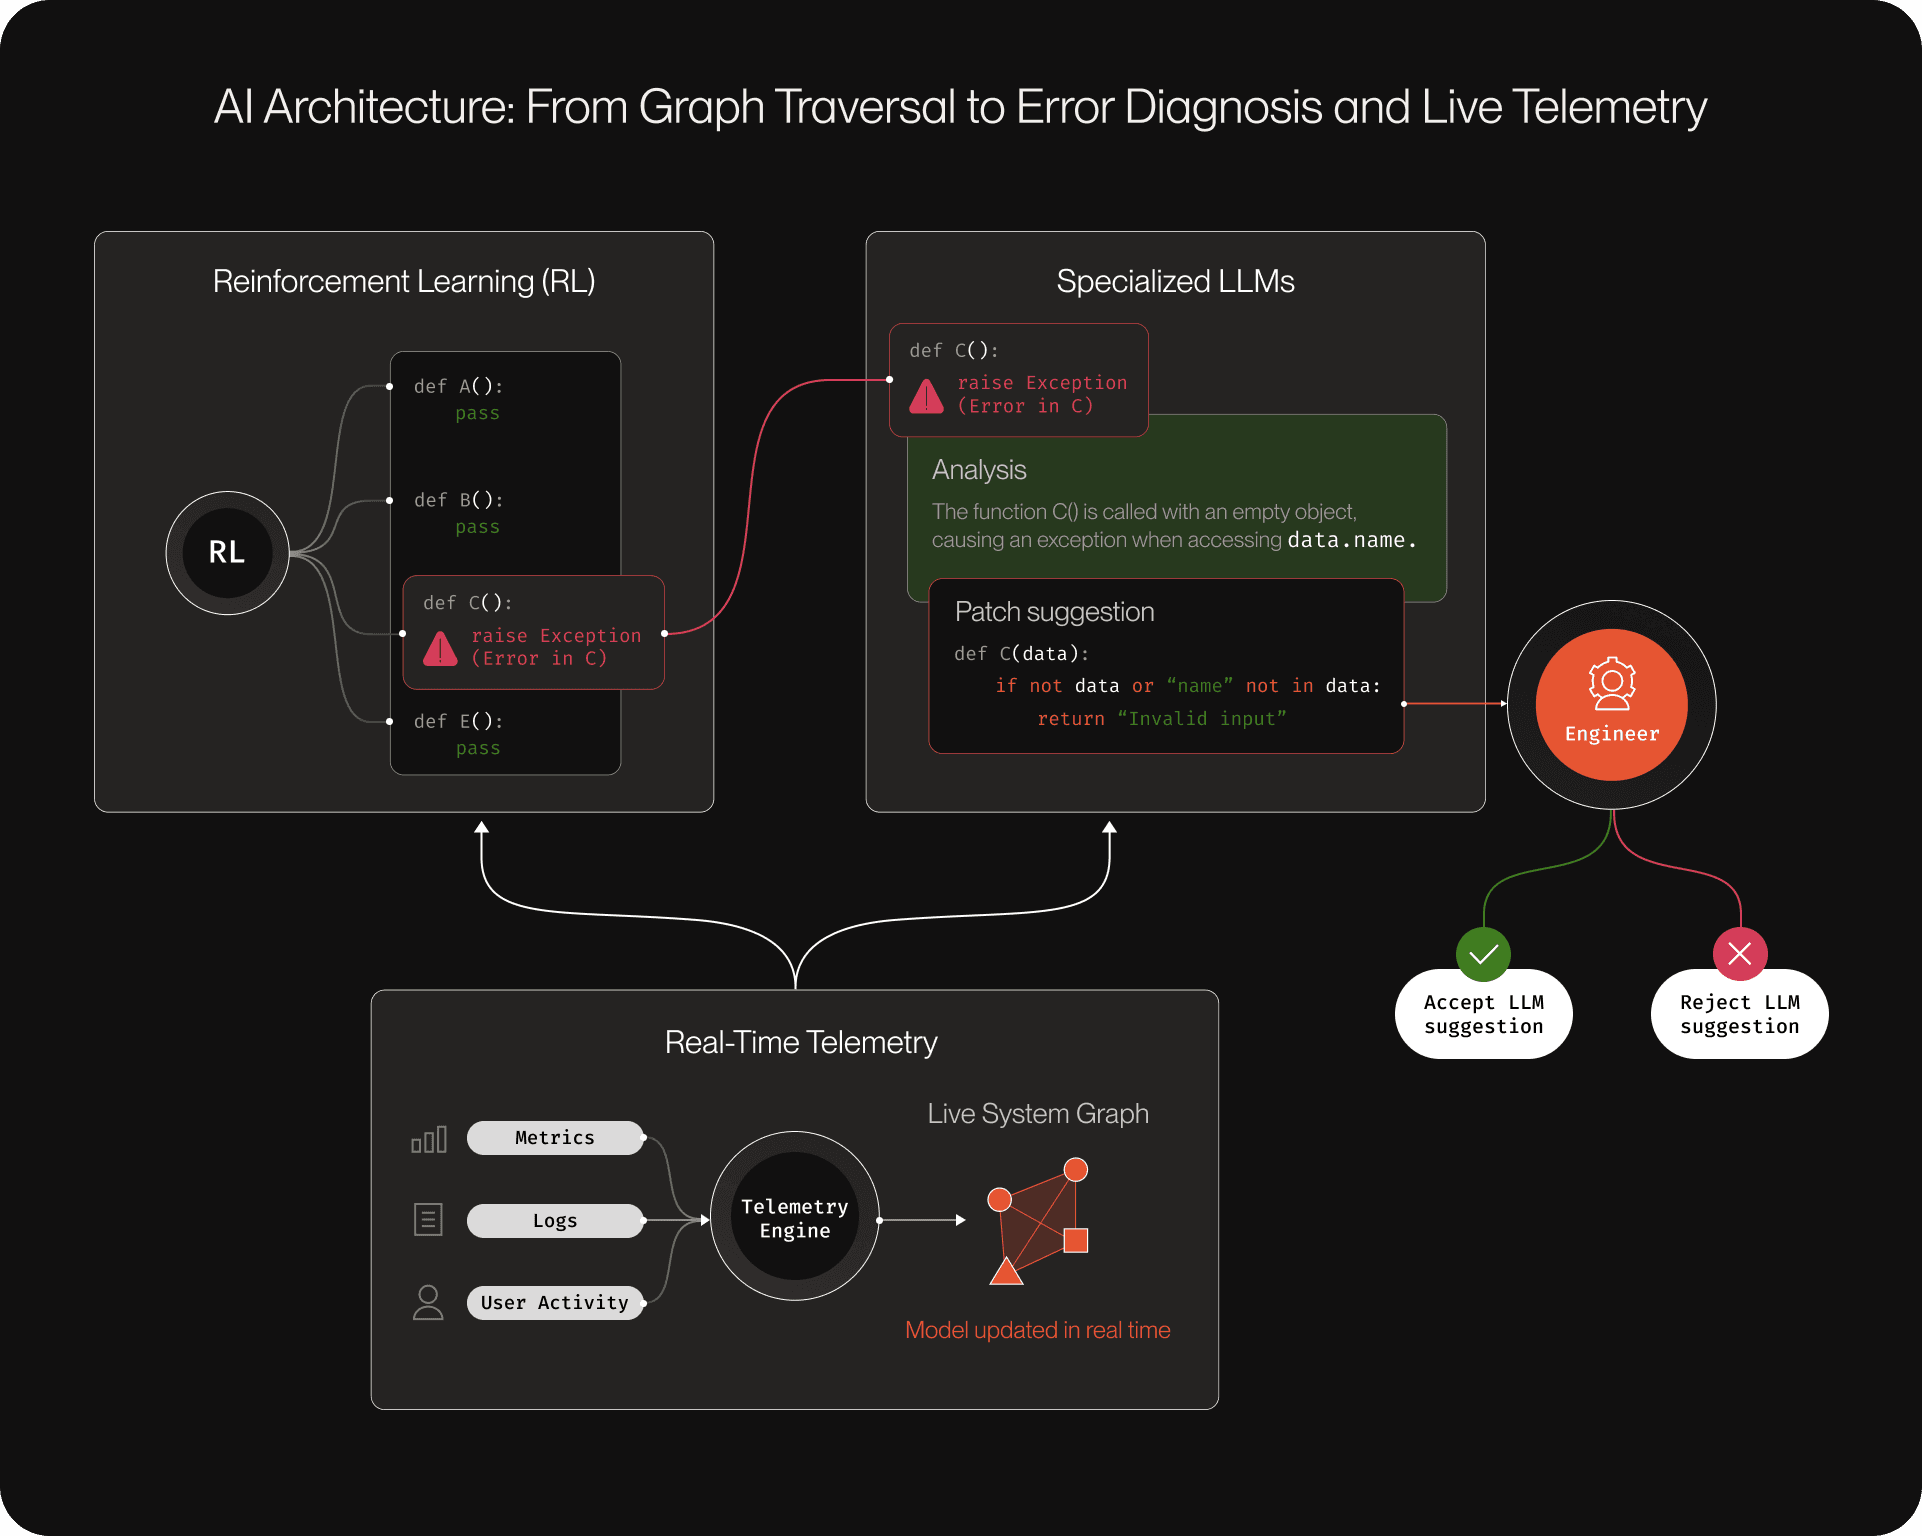
To achieve all this, PlayerZero's architecture employs a multi-model AI strategy that combines reinforcement learning (RL) for efficient graph traversal through complex codebases with specialized large language models (LLMs) optimized for error diagnosis and patch generation. This technical foundation is supported by comprehensive telemetry systems that monitor code execution in real-time, coupled with detailed user session tracing that captures developer interactions and system states.
Why debugging breaks down at scale
As software systems grow more complex, debugging them becomes exponentially harder. Failures are rarely isolated in mature codebases, especially those powering large-scale enterprise environments. Instead, issues cascade across multiple services, hidden behind conditional logic, asynchronous messaging, and unpredictable user states.
Traditional observability tools often struggle to keep up. Logs and traces can highlight symptoms, but rarely reveal the deeper, cross-system causes. Worse still, brittle integrations and legacy services tend to break in subtle ways that defy one-size-fits-all tooling. The debugging challenges in enterprise systems are not just technical, they’re architectural.
PlayerZero is built to handle these realities. It doesn’t just apply AI to raw telemetry; it creates a robust, contextual foundation for debugging complex, distributed systems. That foundation begins with a model of the entire application — not just the data, but the relationships, the workflows, and the user journeys. Unlike observability platforms that focus only on infrastructure or standalone LLM tools that lack system context, PlayerZero creates a unified view of your entire application—connecting user behavior directly to code.
Automation where it helps, control where it counts
PlayerZero models your system end-to-end by constructing a dynamic, living model that mirrors your real-world application. Rather than relying on static maps or lists of services, PlayerZero continuously ingests data from across your stack — logs, metrics, traces, and user sessions — and organizes it into a unified graph that captures infrastructure, code paths, service dependencies, and user activity. This comprehensive system model enables PlayerZero to trace issues through multiple layers, quickly surfacing the exact conditions that cause defects and accelerating root cause analysis by distinguishing true signals from noise.
When problems arise, PlayerZero’s AI automatically correlates disparate signals into a single, cohesive event, applies anomaly detection to flag unusual behaviors, and leverages reinforcement learning to suggest likely root causes. Engineers remain in control: they can validate AI-driven insights, explore the underlying data, and determine the best course of action. This approach blends automation with human oversight, ensuring teams benefit from the speed and context of AI without sacrificing agency or accountability.
Take Cayuse, a leading provider of research administration software. With a mature and complex codebase, the company faced significant challenges in diagnosing issues that spanned multiple teams and services.
They implemented PlayerZero to unify fragmented telemetry and rapidly pinpoint the origins of elusive defects. The impact was immediate: faster triage, fewer escalations, and more time spent solving real problems instead of chasing symptoms. Now, their engineers resolve 90% of issues before they reach the customer and have reduced the average time to resolution by 80%.
This combination of advanced technical capability and proven results demonstrates how PlayerZero transforms debugging from a fragmented, manual process into a streamlined, collaborative workflow — serving as a true debugging companion that delivers both speed and clarity.
Debugging that engineers actually trust
Debugging tools don’t work if teams don’t trust them. That’s why PlayerZero is designed to show its work. The system also explains how it reached that conclusion — what data it pulled together, what patterns it recognized, and how it mapped those against the system model.
One of the key principles behind PlayerZero is that debugging should be explainable. Every insight is traceable, and every conclusion is backed by data. This transparency enables automation to coexist with trust.
Engineers can interact with PlayerZero through a natural language interface that is code-aware and fully traceable. Ask a question like, “Why did this break?” and you’ll get not just a diagnosis, but a walkthrough of the reasoning behind it.
By making debugging visible and inspectable, PlayerZero increases adoption across teams and reduces the friction typically associated with introducing AI into core engineering workflows.
Built for the enterprise, designed for scale
PlayerZero is built to integrate with the systems modern engineering teams already use. It integrates with existing observability stacks, CI/CD pipelines, and telemetry workflows. Whether you're deploying in a fully cloud-native environment or operating on-premises with strict data controls, PlayerZero meets these requirements.
The platform is enterprise-ready by design, with robust support for role-based access control, auditability, and data privacy. Sensitive information remains protected, and deployments can be tailored to meet compliance and security requirements at any scale.
Why you can’t “vibe code” this infrastructure
It’s tempting to think of AI-powered debugging as little more than piping logs into an LLM. In truth, the infrastructure behind PlayerZero is the result of years of research and engineering, bringing together a multi-model AI approach that goes far beyond generic solutions.
At its core, PlayerZero leverages custom reinforcement learning models specifically designed to traverse complex dependency graphs, enabling the system to trace systemic issues across interconnected services and code paths.
Working in tandem, PlayerZero’s fine-tuned LLMs are built for debugging workflows, not just general chat — they analyze the pinpointed areas identified by RL, interpret logs, and propose actionable resolutions with developer-level context. This synergy ensures that PlayerZero doesn’t just surface errors, but understands their origins and suggests meaningful fixes.
PlayerZero continuously ingests telemetry and behavioral data to keep its system model up to date, allowing its RL and LLM components to operate on the latest state of your application. This level of precision and context — where structural graph intelligence meets semantic code analysis — isn’t something teams can create in a weekend hackathon; it’s robust infrastructure, not magic. While rebuilding a platform like this internally might take months or years, integrating PlayerZero into your stack takes days.
The new standard for debugging
When teams adopt the PlayerZero approach to debugging, they experience faster, more accurate issue resolution and improved collaboration across engineering, support, and QA.
By automatically linking support tickets and telemetry to the precise lines of code responsible for defects, PlayerZero provides immediate context, eliminating guesswork and enabling developers to troubleshoot with confidence. Centralizing workflows and codebase knowledge, PlayerZero breaks down silos and empowers teams to work together efficiently, accelerating diagnosis and fixes.
PlayerZero transforms debugging from a fragmented, manual process into a unified, data-driven workflow. Teams gain end-to-end visibility, reduce resolution times, and deliver more reliable software, all while maintaining a shared understanding of both technical and customer impact.
If you're ready to bring intelligent, explainable debugging into your engineering workflow, book a demo and see how PlayerZero can make your team faster, sharper, more resilient, and free to add more value to your enterprise.