Evaluating diagnostic accuracy across black-box boundaries with incomplete telemetry
Production debugging assumes you can see what happened. Open the trace. Check the logs. Follow the request through each service. The entire discipline of observability is built on this premise, and the tooling ecosystem reflects it: if you instrument enough, you can reconstruct any failure.
In practice, the premise fails often. Third-party APIs do not expose their internals. Customer-managed middleware operates outside your instrumentation perimeter. Legacy services predate your observability stack. Webhook endpoints return a status code and nothing else. When a production issue crosses one of these boundaries, the debugging process stalls at the edge of what you can see.
We wanted to measure something specific about this problem: when the AI production engineer diagnoses a black-box issue using only the code, configuration, and partial telemetry available on the caller's side, how often does that diagnosis match the root cause that is eventually confirmed through traditional investigation?
That traditional investigation is the slow path. It involves escalating to vendors, coordinating with customer IT teams, and attempting to reproduce the issue in staging. It takes days or weeks. But it eventually produces a confirmed root cause in cases where the issue is resolved at all. This gives us a ground truth to validate the simulation's diagnosis against.
Across 4,280 production issues at 14 software companies over five months, we identified 2,612 issues that involved at least one black-box boundary and where the root cause was independently confirmed through traditional methods. For each of these, the AI production engineer had produced a simulated diagnosis using only the information available on the caller's side.
The simulated diagnosis matched the confirmed root cause 87% of the time. The median time to produce the simulated diagnosis was 1.8 hours. The median time to reach the same conclusion through the traditional path was 14.2 days.
To our knowledge, this is the first study that systematically compares simulated diagnoses against independently confirmed root causes for issues spanning black-box integration boundaries. Only PlayerZero has this data, because only PlayerZero generates simulated execution traces for unobservable components and tracks whether those traces match the eventual ground truth.
This work extends the Sim-1 simulation engine into a domain where it operates under more severe constraints. Our previous study evaluated Sim-1's simulation accuracy across instrumented codebases. Our pre-merge prediction work applied simulation to forecast production regressions before code ships. Here, the simulation must reconstruct what likely happened inside a component it cannot observe, using only the code on the caller's side, the signals at the boundary, and the learned behavior patterns in the production world model. Since publishing Sim-1, we have executed over 750,000 production simulations. The subset analyzed here represents approximately 52,000 simulations targeting issues with incomplete observability.
Key findings
- 87% blind diagnosis match rate. Simulated diagnoses matched the independently confirmed root cause 87% of the time: 94% at full observability, 88% at partial, 71% at minimal.
- 73% of production issues involve at least one black-box boundary. Incomplete observability is the default, not the edge case.
- 1.8 hours vs. 14.2 days. The simulation reached the same conclusion as the traditional investigation, faster by roughly an order of magnitude.
- 87% of root causes were on the caller's side. The black-box component was almost always behaving as designed.
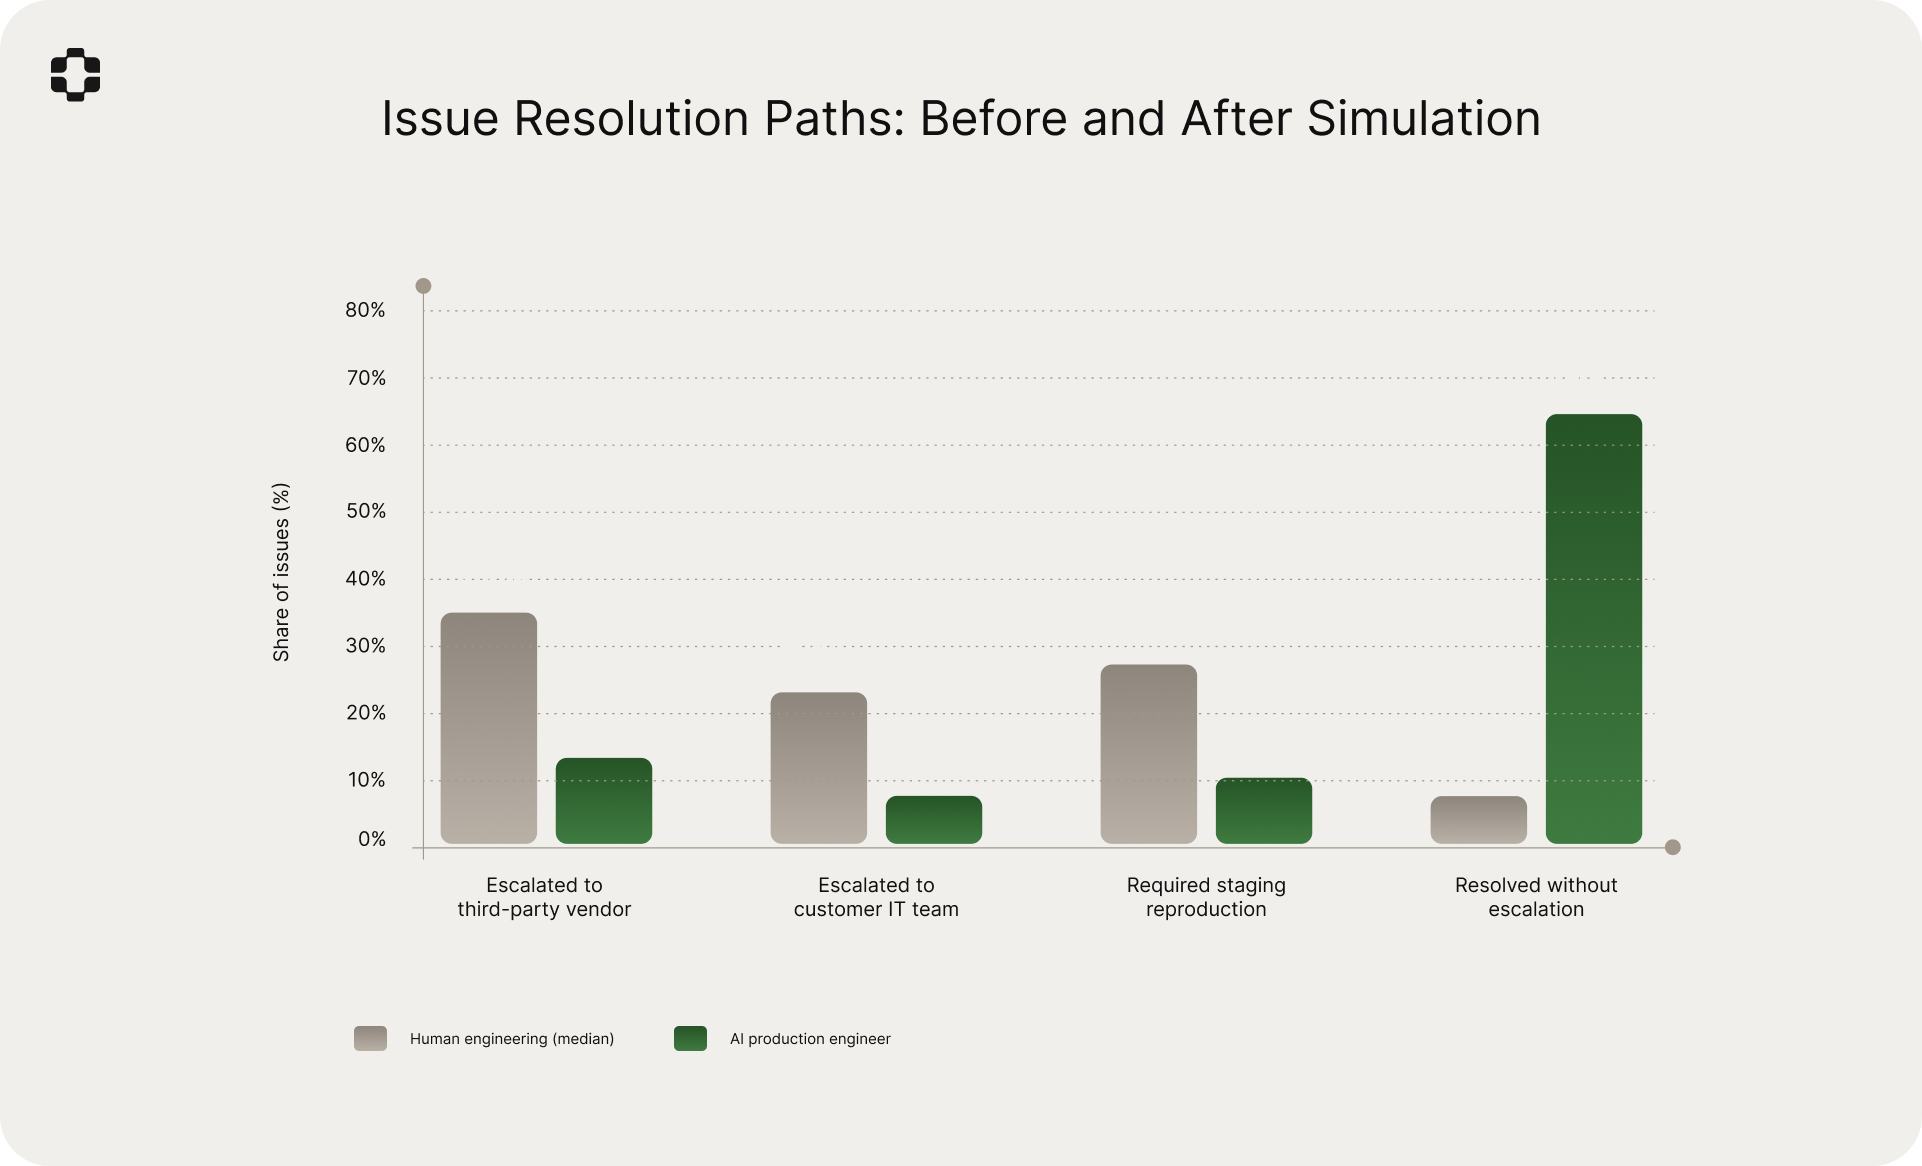
- 66% of issues resolved without escalation with the AI production engineer, compared to 9% in the human-only workflow.
- Silent failures had 31% human resolution rate. The hardest category for manual debugging was the most improved by simulation.
- 4.7 wrong hypotheses before the right one on partial-observability issues. Simulation narrows the hypothesis space.
- Staging reproduction fails 66% of the time for black-box issues.
Defining the problem: what is a black-box boundary?
We define a black-box boundary as a point in the execution path of a production issue where direct observability (logs, traces, metrics, or application-level signals) is unavailable for the component on the other side. The engineer can see what was sent to the component and what came back, but cannot see what happened internally.
Not all unobservable components are equivalent. A payment processor that returns structured error codes provides more boundary signal than a legacy service that returns a generic 500. A vendor-hosted infrastructure component that exposes latency metrics provides more signal than a customer-managed middleware that silently transforms data. The amount of information available at the boundary varies, and this variation directly affects diagnostic difficulty.
We classified each production issue by the degree of observability available across all components in the failure chain:
Full observability. Logs, traces, or metrics were available for every component. 27% of issues.
Partial observability. One or two components in the chain were black boxes. Boundary signals (status codes, response payloads, timing) were available, but internal signals were not. 54% of issues.
Minimal observability. Three or more components lacked direct instrumentation, or the available boundary signals were too sparse to constrain the hypothesis space. 19% of issues.
73% of production issues involved at least one black-box boundary. The industry conversation around observability tends to treat incomplete telemetry as a gap to be closed through better instrumentation. Our data suggests a different framing: for most production issues in complex B2B SaaS systems, there will always be components you cannot instrument because you do not own them, your customers manage them, or they predate your observability stack.
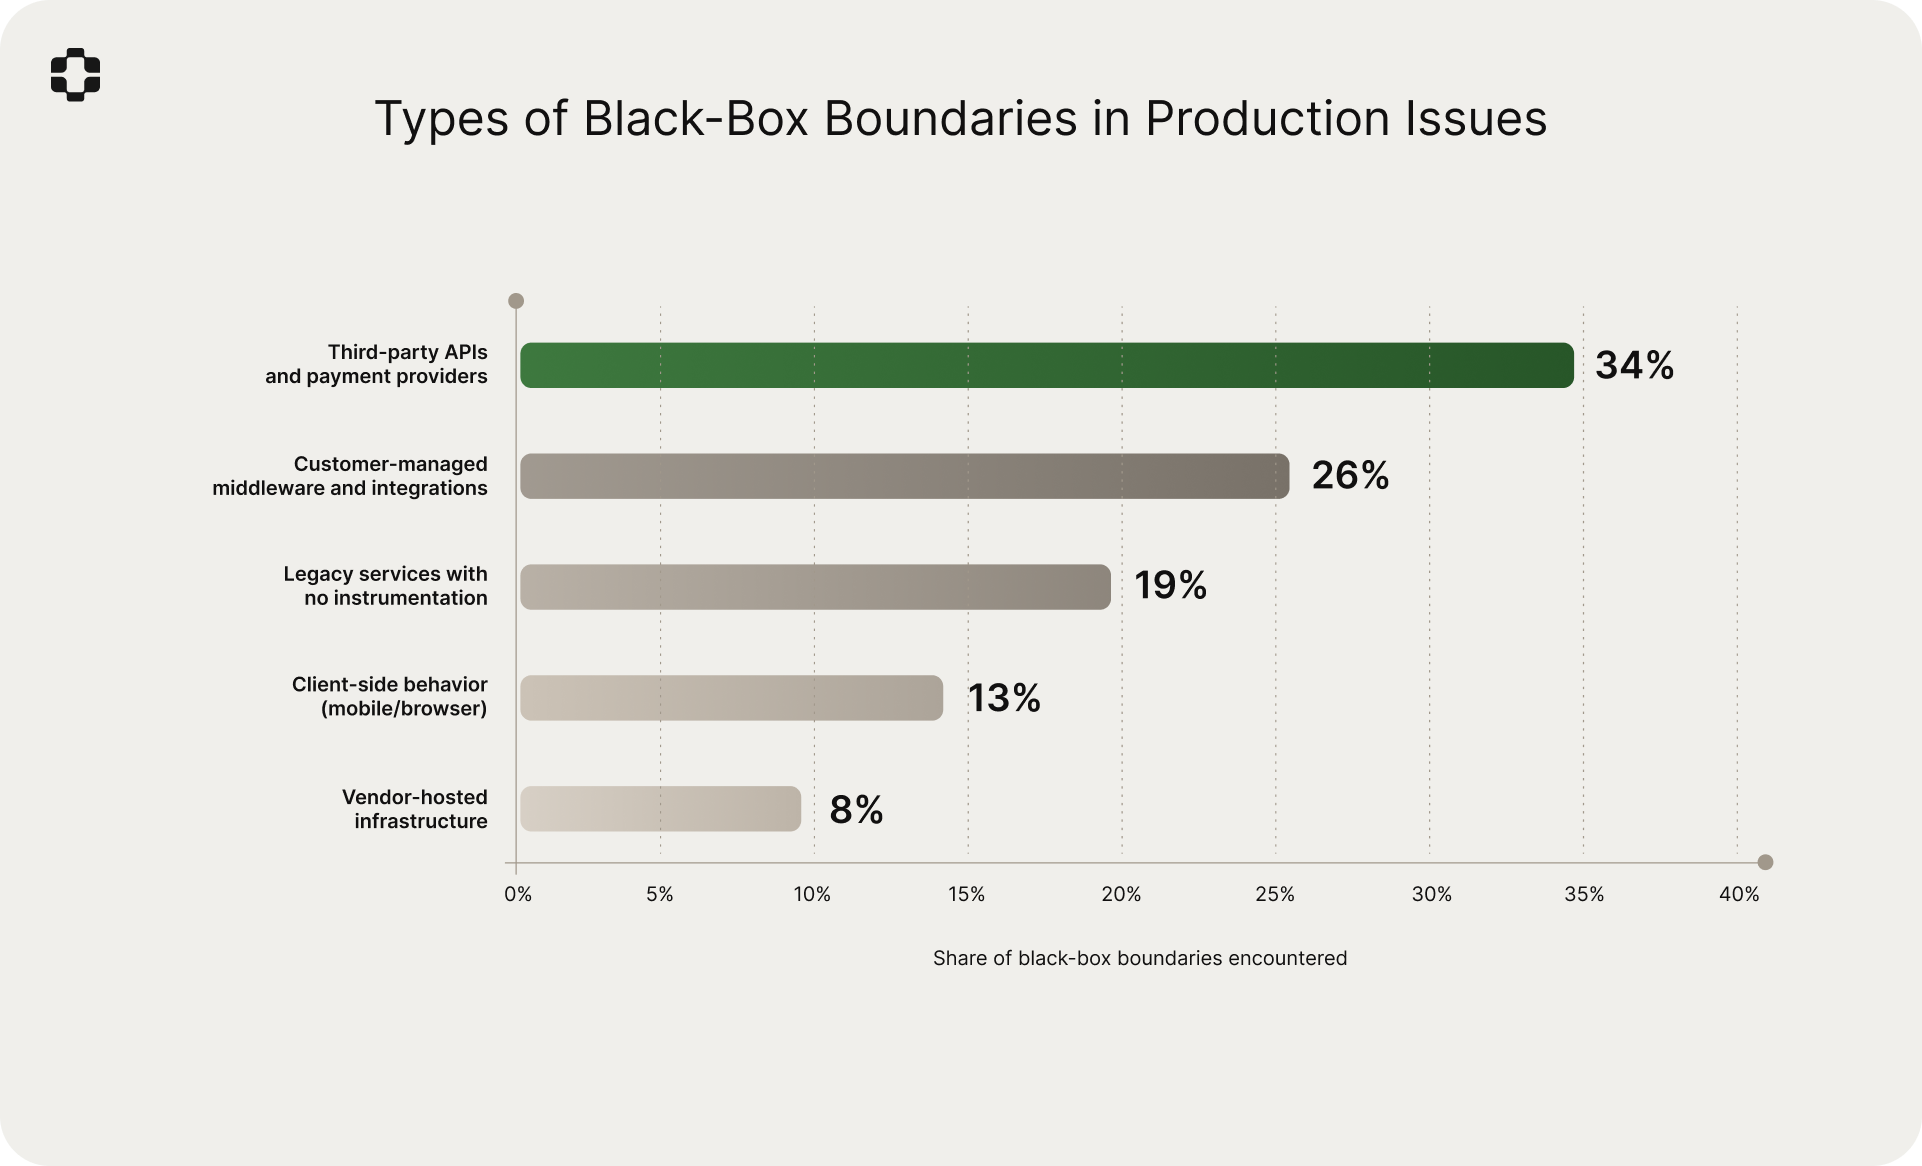
Third-party APIs and payment providers accounted for 34% of black-box boundaries. Customer-managed middleware and integrations: 26%. Legacy services with no instrumentation: 19%. Client-side behavior: 13%. Vendor-hosted infrastructure: 8%.
The blind diagnosis study
Why this measurement matters
When an issue crosses a black-box boundary, the standard workflow proceeds like this: the engineer observes the symptom, checks whatever signals are available at the boundary, forms a hypothesis, and then attempts to validate it. Validation usually requires escalating to the third-party vendor (median resolution in our dataset: 6.8 days), coordinating with the customer's IT team (median: 4.2 days), or attempting to reproduce in staging (success rate for black-box issues: 34%).
These paths are slow, but not arbitrary. When they succeed, they produce a confirmed root cause: a diagnosis verified against information from the other side of the boundary. Vendor support confirms the API behavior. Customer IT shares the middleware configuration. The traditional path is expensive, but it grounds the diagnosis in reality.
This creates a natural experiment. If the AI production engineer generates a diagnosis using only the information available on the caller's side (the code, configuration, partial telemetry, and production world model), and the traditional investigation independently produces a confirmed root cause, we can measure how often the two agree. Agreement means the simulation reached the right conclusion without the information the traditional path required.
We call this the blind diagnosis match rate: the percentage of cases where the simulated diagnosis matches the root cause that was independently confirmed through traditional methods. It is "blind" in the sense that the simulation never had access to the information on the other side of the boundary. It reconstructed what likely happened from the caller's side only.
Study design
Dataset. 4,280 production issues across 14 B2B SaaS companies over a five-month period from August through December 2025. These are the same companies as our pre-merge prediction study, allowing us to leverage existing production world models.
Inclusion criteria. Of the 4,280 issues, we selected the 2,612 where: (a) at least one black-box boundary was involved, (b) the AI production engineer produced a simulated diagnosis, and (c) the root cause was independently confirmed through traditional methods. Criterion (c) provides the ground truth. Issues where the traditional path did not produce a confirmed root cause were excluded.
Diagnosis comparison. For each included issue, an engineering review panel compared the simulated diagnosis against the confirmed root cause across three dimensions: (1) whether the simulation correctly identified the failing component or interaction, (2) whether it correctly identified the mechanism of failure, and (3) whether it correctly identified the conditions under which the failure occurred. A diagnosis was scored as a "match" if it was correct on all three dimensions.
Comparison baseline. For resolution rate and time-to-root-cause comparisons, we used historical data from the same companies in the six months prior to PlayerZero deployment, selecting issues of comparable complexity and verifying consistent issue type distributions.
Results: 87% match rate
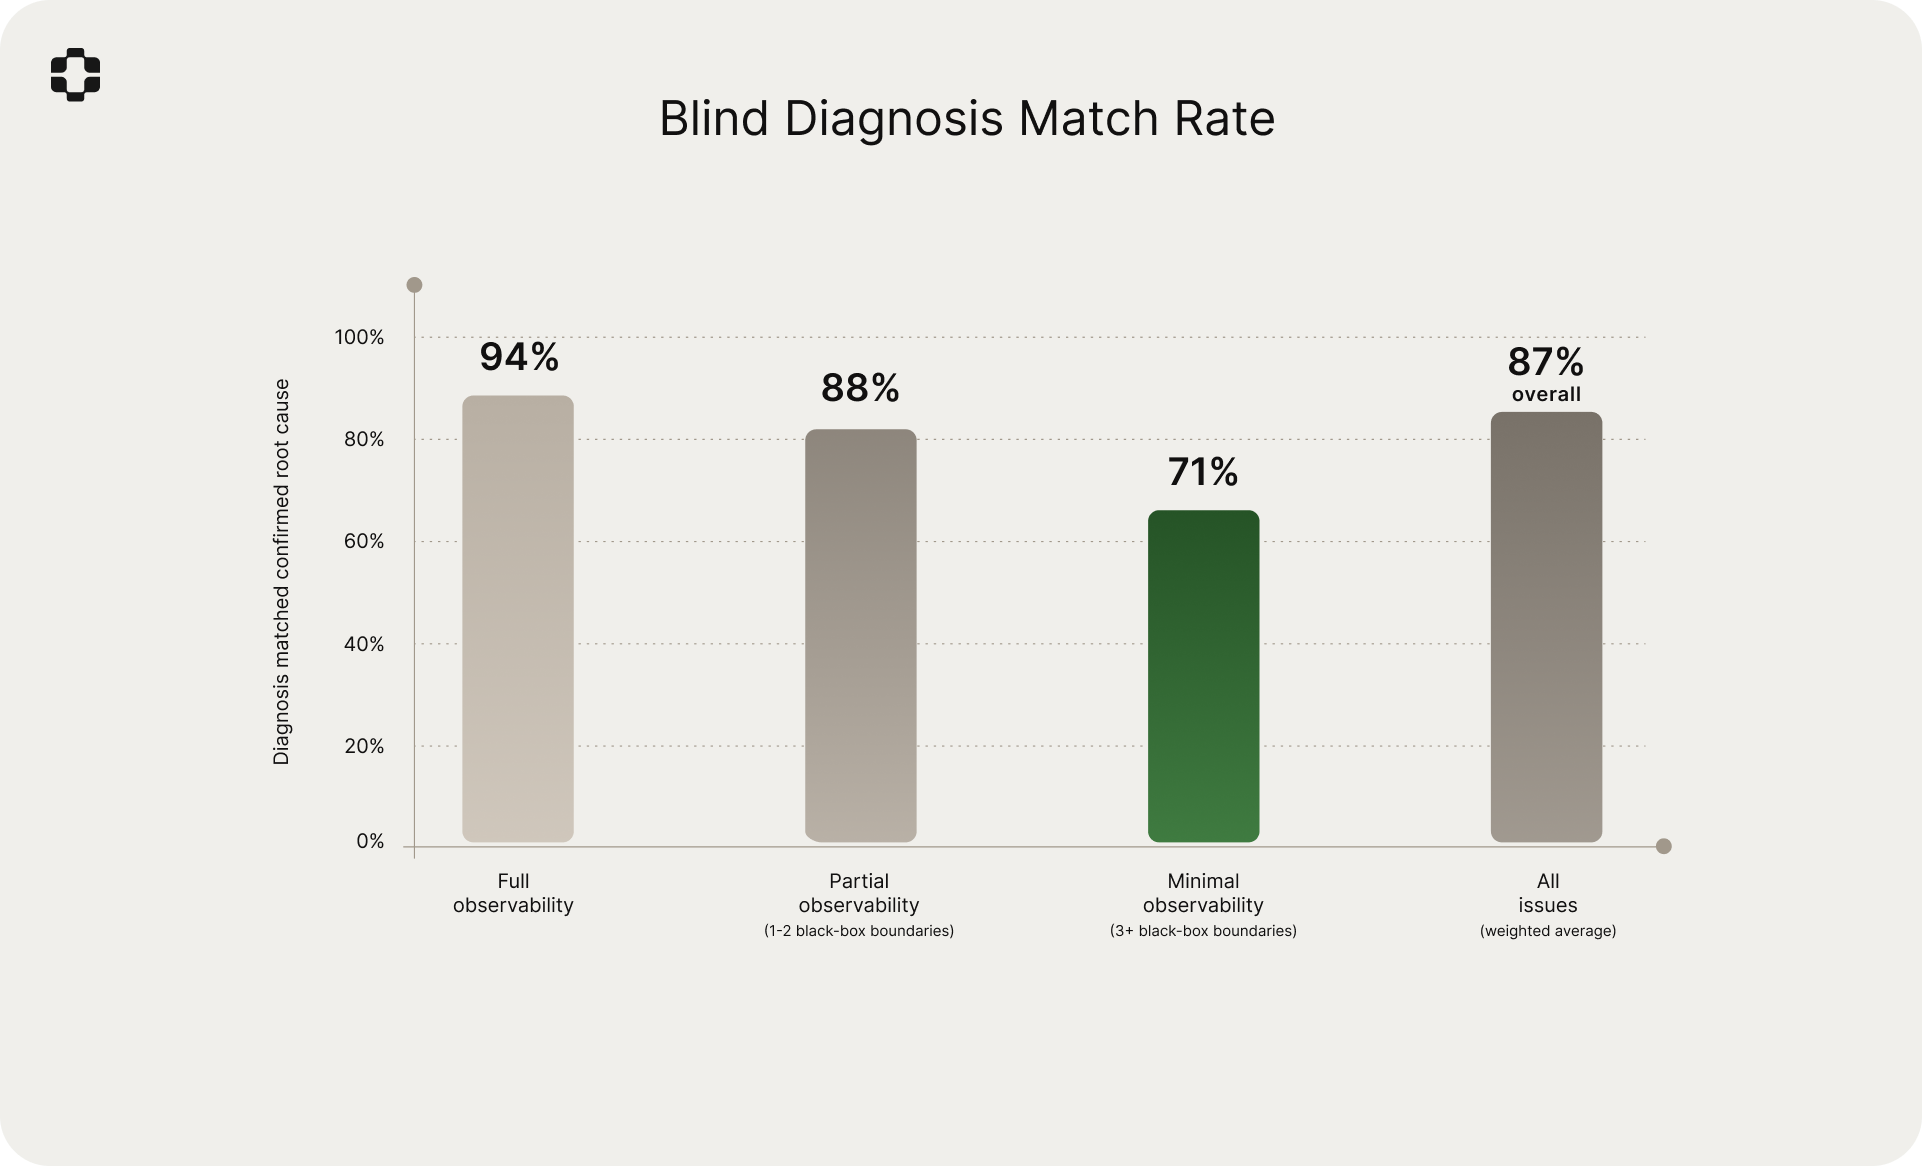
Across all 2,612 issues in the evaluation set, the simulated diagnosis matched the confirmed root cause 87% of the time.
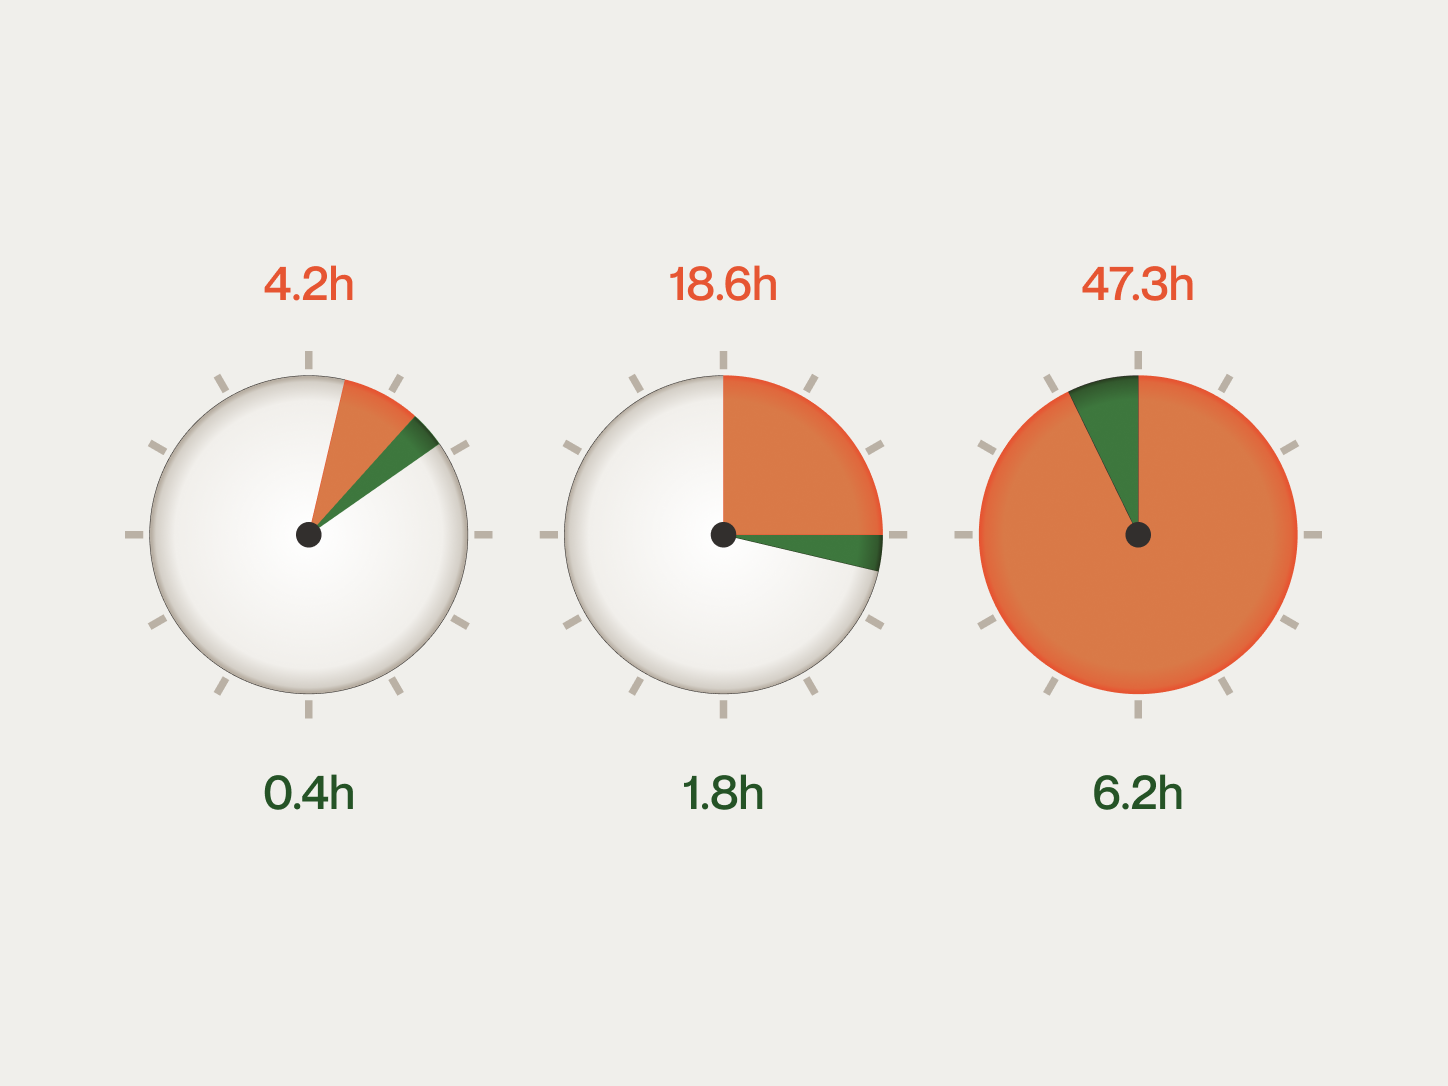
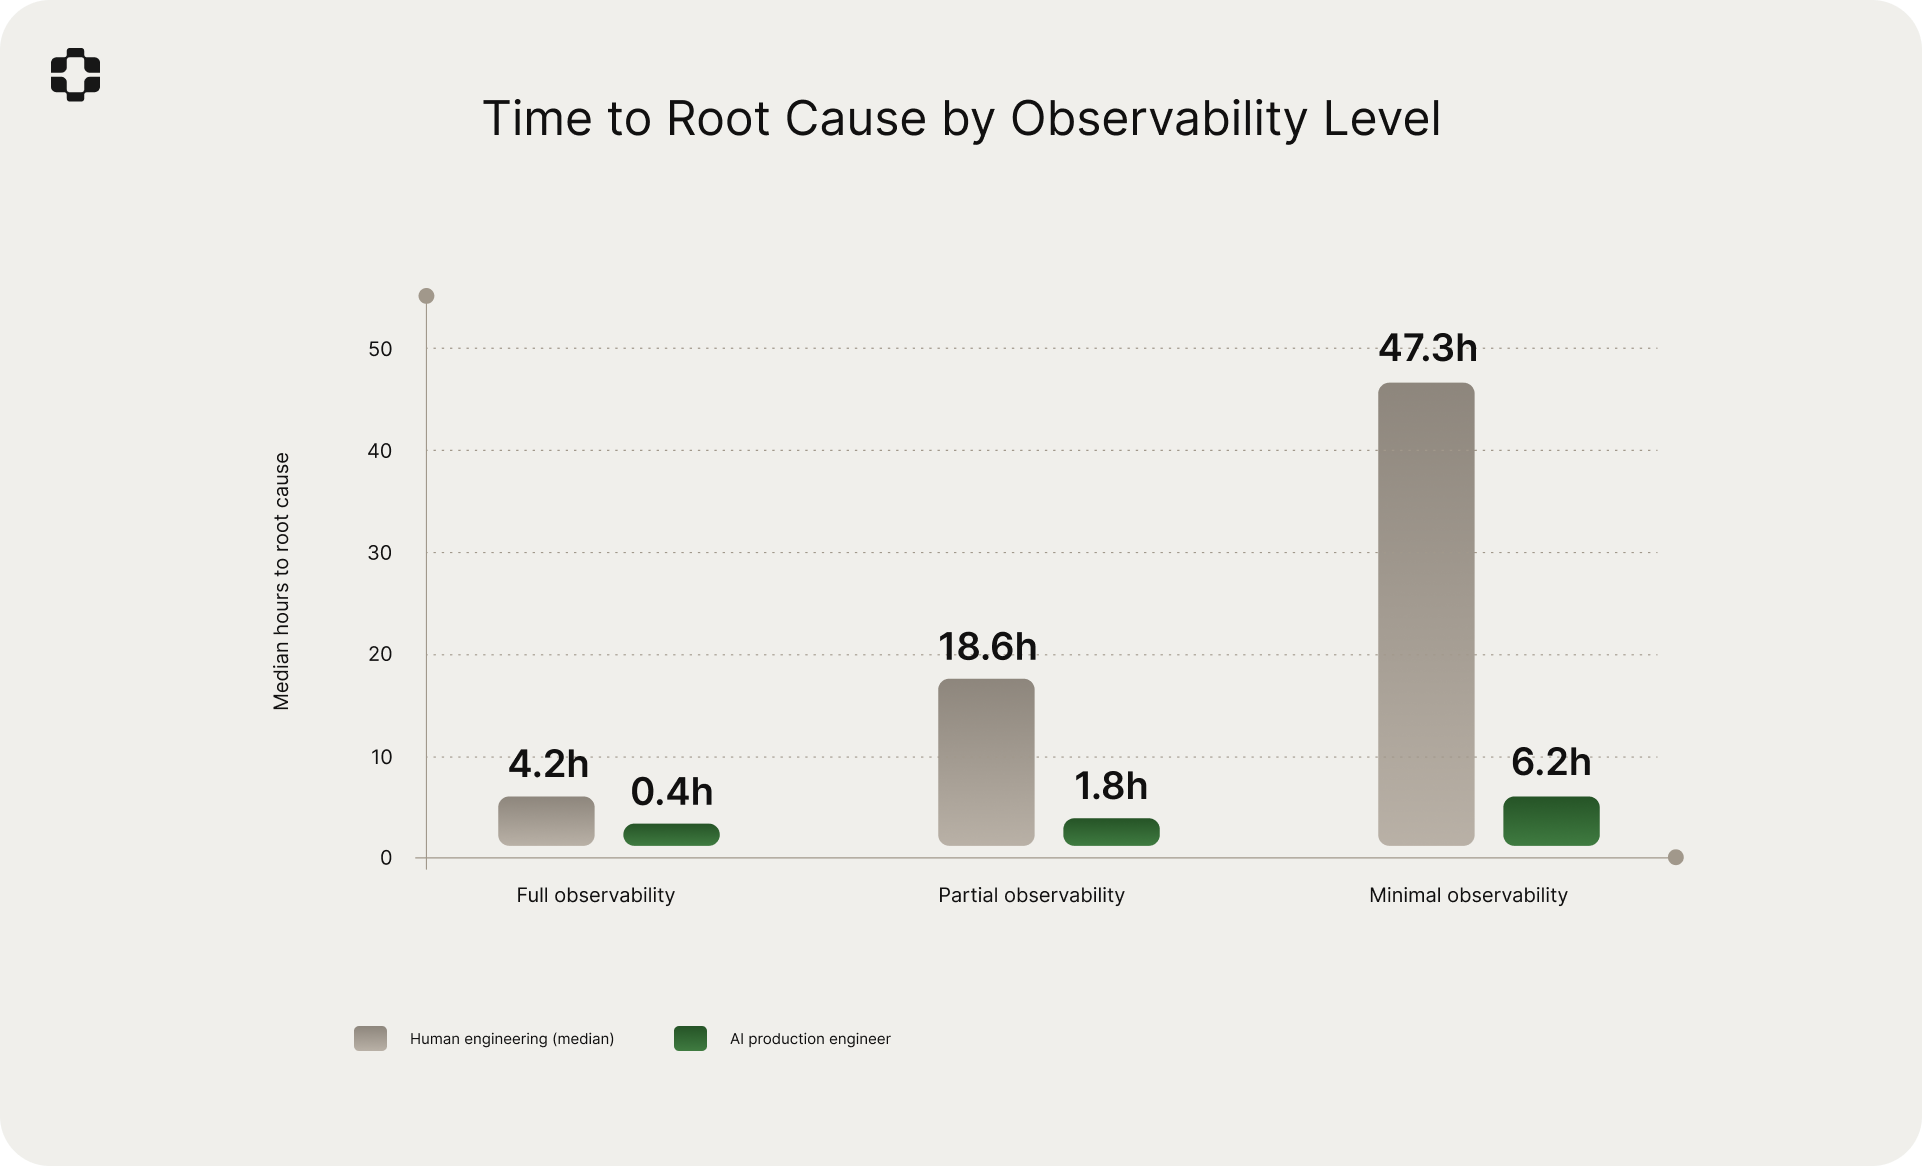
Full observability: 94%. The simulation's advantage was primarily speed (median 0.4 hours vs. 4.2 hours). The 6% miss rate concentrated in issues involving subtle timing interactions across multiple services.
Partial observability: 88%. With one or two black-box boundaries, the simulation maintained high accuracy. The 12% miss rate was primarily in cases where the black-box component exhibited behavior that was both undocumented and had no precedent in the production world model's history.
Minimal observability: 71%. With three or more black-box boundaries, accuracy dropped meaningfully. The 29% miss rate reflects a real limitation: when boundary signals are sparse and multiple unobservable components interact, the hypothesis space is wider than available constraints can narrow.
The 88% match rate on partial-observability issues is the most operationally significant number. These issues represent 54% of the dataset and are where the traditional path is slowest (median 14.2 days) while the simulation is fast (median 1.8 hours). For the most common class of black-box issues, the simulation produces the correct diagnosis nearly nine times out of ten, weeks before the traditional path reaches the same conclusion.
Why 87% and not higher
The 13% miss rate falls into three categories.
Undocumented behavior with no historical precedent (47% of misses). The black-box component behaved in a way that was not documented, not consistent with its API specification, and had never been observed in previous interactions. The production world model had no basis to reconstruct this behavior. Example: a payment processor that silently changed its retry serialization logic in an unannounced update.
Combinatorial interactions across multiple black boxes (31% of misses). Reconstructing behavior across three or more unobservable components simultaneously produced a hypothesis space too wide for the available constraints. The correct root cause was often in the simulation's top-five hypotheses, but not ranked first.
Ambiguous boundary signals (22% of misses). The signals at the boundary were consistent with multiple root causes, and the simulation selected the more common one while the actual cause was rarer. These are cases where vendor or customer IT information was genuinely necessary to disambiguate.
We view the 71% match rate on minimal-observability issues as the current frontier. Improving it requires richer boundary signals, deeper production world model knowledge about specific integration behaviors, or both. Both improve over time as the system processes more issues.
How the simulation works
The AI production engineer combines three sources of information to diagnose black-box issues.
The code and configuration on the caller's side. The production world model understands exactly what the calling code does: what data it constructs, how requests are formatted, how responses are parsed, what error handling exists, and how configuration parameters affect behavior. This is ground truth, not inference.
Partial telemetry from the boundary. Even when the internals of a third-party system are invisible, the boundary emits signals. HTTP status codes, response payloads, response timing, error messages, retry behavior, and rate-limiting headers all constrain what could have happened on the other side. The simulation engine treats these as constraints, narrowing the space of plausible execution paths.
Learned patterns from production history. The production world model accumulates knowledge about how specific integrations behave across many issues. It learns that a particular payment processor returns certain error codes under certain conditions, that a particular customer's middleware rejects payloads deviating from an expected schema, and that a particular identity provider handles edge cases in a particular way. This accumulated context enables reconstruction of likely behavior where direct observation is impossible.
The engine synthesizes these inputs into a reconstructed execution trace: a detailed account of what likely happened inside the black-box component, with confidence scores, ranked alternative hypotheses, and specific verifiable predictions. This is the same Sim-1 engine described in our initial publication, extended from fully-instrumented codebases to partially-observable systems.
The operational impact
The blind diagnosis match rate measures accuracy. The following results measure the downstream effect on how issues are resolved.
Time to root cause
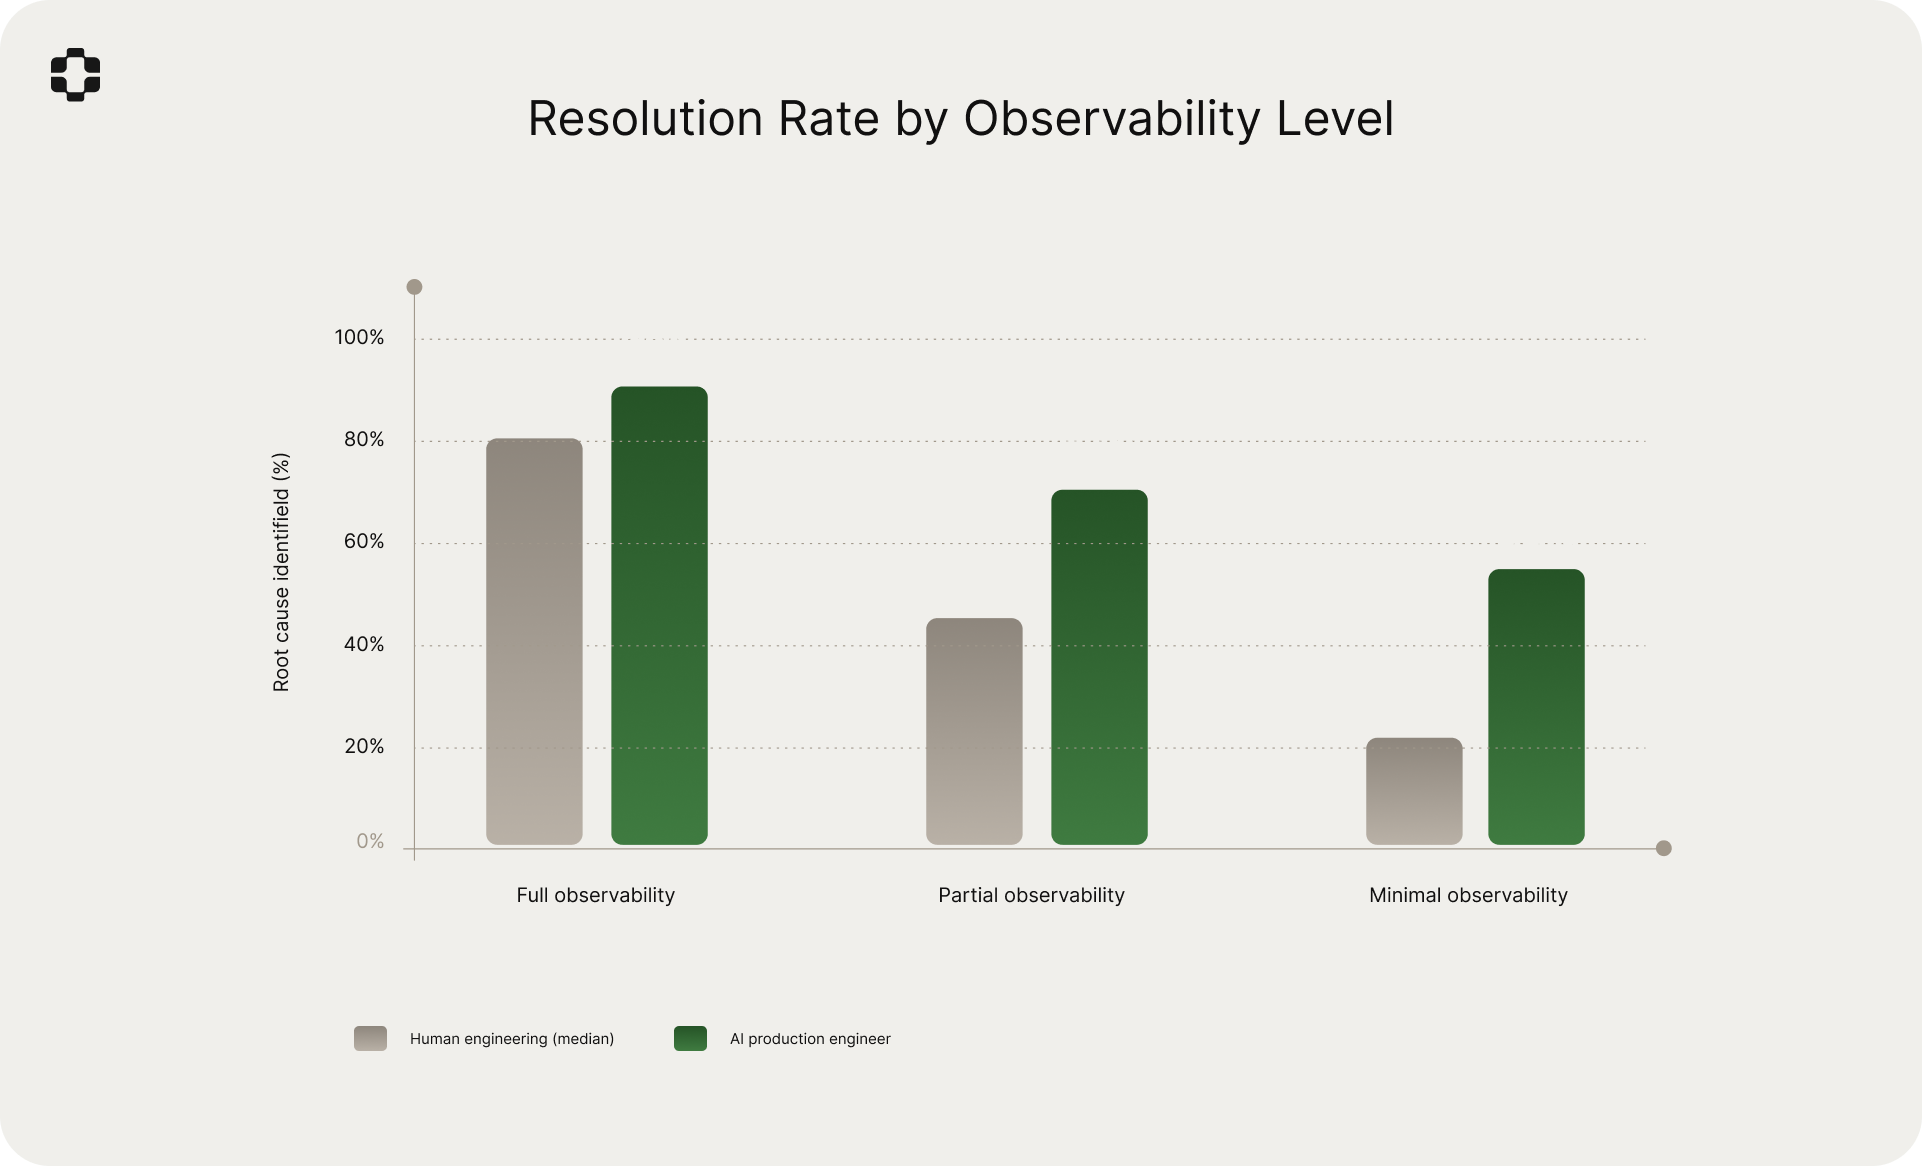
Resolution rate
Escalation reduction
Representative scenarios
Healthcare: FHIR endpoint returning inconsistent patient matching
A health information exchange platform serving 23 hospital systems.
The issue. A hospital reported that patient records were intermittently failing to match during cross-facility lookups. The matching service returned 200 with zero results. No errors, no alerts. The hospital's EHR vendor operated the FHIR endpoint, and the vendor's logs were not accessible.
What the engineer saw. Correctly formatted FHIR search requests. Valid 200 responses with empty bundles. Normal timing. Roughly 12% of lookups affected, no obvious pattern.
What the simulation found. The AI production engineer examined the calling code and identified that FHIR search parameters were constructed from an HL7v2 ADT message parser that emitted fields in source order. The production world model's learned patterns for this vendor's FHIR implementation indicated exact-match behavior on the family parameter. The simulation identified that patients with accented characters in surnames were being URL-encoded with a UTF-8 representation that the vendor's endpoint normalized differently than the calling code expected. It generated a trace showing the encoding mismatch and predicted which patient demographics would be affected.
Confirmed root cause (arrived 8 days later via vendor). Encoding mismatch on accented surname characters. The simulation's diagnosis was exact.
Time comparison. Simulation: 2.1 hours. Traditional path: 8 days.
Financial services: payment processor webhook mutation on retry
A B2B payments platform processing institutional transactions.
The issue. Settlement notifications arriving with incorrect amounts. Discrepancies were small (often sub-cent) and intermittent, concentrated among transactions that had experienced at least one delivery timeout.
What the engineer saw. Webhook payloads showed amounts not matching expected settlement values. The payment processor's dashboard showed correct amounts. Roughly 3% of settlements affected.
What the simulation found. The AI production engineer analyzed the webhook ingestion code, the processor's documented retry behavior, and the production world model's learned patterns. It identified that when the processor's initial webhook delivery timed out, the processor retried with a re-serialized payload applying current currency conversion rates rather than rates at time of settlement. For transactions settling near the nightly rate change boundary, the retried payload contained a slightly different amount.
Confirmed root cause (arrived 11 days later via processor support). Re-serialization on retry applying updated conversion rates. Exact match.
Time comparison. Simulation: 3.4 hours. Traditional path: 11 days.
Enterprise supply chain: EDI translator silently truncating fields
A global logistics platform integrating with a major retailer's supply chain system.
The issue. Purchase orders arriving with truncated ship-to addresses, causing shipments to route to wrong distribution centers. Discovered only when physical deliveries arrived at incorrect locations days later.
What the engineer saw. Outbound EDI messages contained full addresses. The retailer's system showed truncated addresses. The EDI gateway between them was a third-party VAN provider with no log access.
What the simulation found. The AI production engineer analyzed the platform's EDI message construction code and the production world model's knowledge of the VAN provider's processing from historical issues. It identified that the platform's recent address format migration pushed some addresses beyond 35 characters in the N301 segment, and the VAN's translator was configured with a field length limit based on a 2019 companion guide version. The VAN silently truncated without error.
Confirmed root cause (arrived 9 days later via joint investigation with VAN). N301 field truncation at 35-character limit per 2019 companion guide. Match on all three dimensions: component, mechanism, conditions.
Time comparison. Simulation: 4.8 hours. Traditional path: 9 days.
Telecommunications: SMS gateway undocumented per-carrier rate limiting
An enterprise communications platform serving high-volume messaging customers.
The issue. SMS transaction alerts delivered with 15-45 minute delays to a financial services customer with a 5-minute compliance requirement. The SMS gateway returned 202 (Accepted) for every message.
What the engineer saw. All messages dispatched within milliseconds. Delivery receipts showed delays clustering around specific time windows and carrier networks.
What the simulation found. The AI production engineer analyzed the dispatching code and learned delivery receipt timing patterns. It identified undocumented per-carrier-per-account rate limits in the SMS gateway (approximately 50 messages/minute/carrier). During market hours, the customer's volume to the two largest carriers exceeded this threshold. The simulation predicted delay concentration during market open and close windows, matching observations.
Confirmed root cause (arrived 16 days later via gateway provider). Per-carrier rate limiting at ~50 messages/minute, undocumented. The provider acknowledged the limits only after receiving the simulation's specific evidence.
Time comparison. Simulation: 1.6 hours. Traditional path: 16 days.
Observations across the dataset
Silent failures are disproportionately expensive
Issues where the black-box component returned success but produced incorrect behavior accounted for 41% of all black-box issues, with a human resolution rate of only 31%. Median time to root cause: 34.2 hours. These are harder because there is no error signal to anchor the investigation. The engineer works backwards from a downstream symptom (wrong data, missing records) to a boundary that shows no problem. The simulation's match rate on silent failures was 83%.
The wrong hypothesis problem
Engineers tested a median of 4.7 distinct hypotheses before identifying the correct root cause on partial-observability issues, and 8.3 on minimal-observability issues. Most debugging time is spent investigating hypotheses that turn out to be wrong. In 71% of cases where the AI production engineer's top-ranked hypothesis matched the confirmed root cause, the engineer's own investigation sequence would have tested it third or later. The simulation's value is not only that it identifies the right answer. It identifies it first.
Integration age correlates with debugging difficulty
Integrations in production for more than three years had a 2.3x higher rate of black-box issues than those less than one year old. Older integrations accumulate configuration drift, version mismatches, and undocumented workarounds. The production world model retains knowledge that would otherwise be lost to team turnover, making it particularly effective for the oldest and most complex integrations.
Staging reproduction is unreliable for black-box issues
Staging reproduction succeeded in only 34% of attempts for black-box issues, dropping to 18% for issues with multiple black-box boundaries. Staging environments cannot replicate the exact behavior of third-party systems, customer-managed middleware, or production timing conditions. Simulation bypasses the reproduction dependency entirely by reconstructing the execution path from production signals.
Simulation accuracy by component type
For a 20% validation sample, we compared simulated execution traces against confirmed root causes across five dimensions.
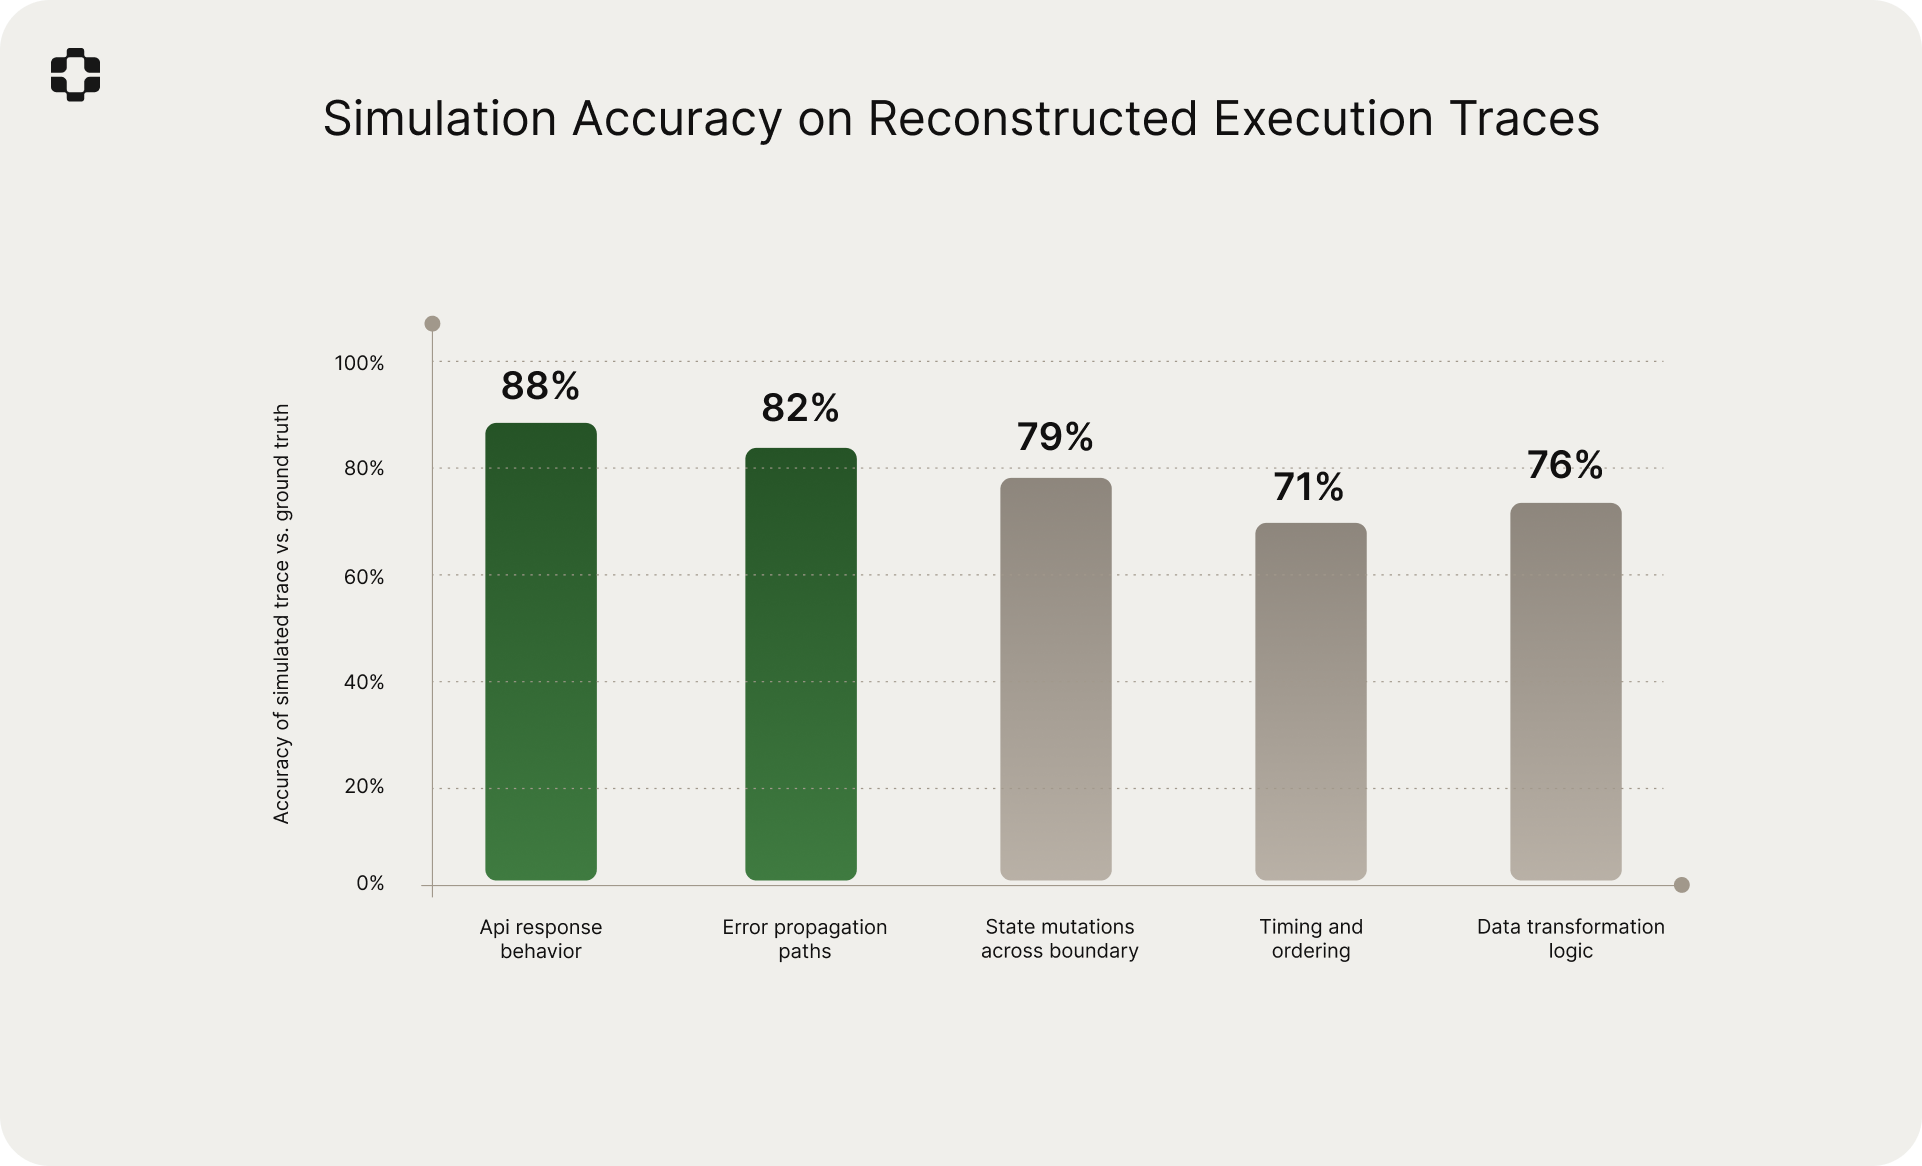
API response behavior: 88%. Error propagation paths: 82%. State mutations across boundary: 79%. Data transformation logic: 76%. Timing and ordering: 71%. These rates are for reconstruction of behavior inside components the simulation cannot directly observe, and are expectedly lower than Sim-1's 92.6% on fully-instrumented codebases. The 87% blind diagnosis match rate suggests the accuracy is operationally sufficient.
Limitations
The match rate applies only to the 2,612 issues where ground truth was available through traditional methods. Issues where the traditional path did not produce a confirmed root cause were excluded. The true accuracy on unresolved issues is unknown.
The comparison baseline uses historical data, not a controlled experiment. Teams and processes may have changed between periods. We controlled for comparable complexity and consistent issue type distributions.
The 71% match rate on minimal-observability issues means 29% of diagnoses in the hardest category were wrong. Simulation does not eliminate the need for vendor collaboration in these cases, though it narrows the hypothesis space.
Time-to-root-cause comparisons include waiting time in the human baseline. The comparison is most relevant for SLA purposes and less relevant when measuring active engineering effort.
The dataset is concentrated in B2B SaaS. The patterns likely generalize to other domains with complex integration landscapes, but this is not yet verified.
What this suggests
The central finding is that code simulation can reconstruct what happened inside unobservable components with 87% accuracy using only the information available on the caller's side. This is possible because the production world model combines three inputs that are individually insufficient but collectively powerful: deep understanding of the calling code, partial signals from the integration boundary, and learned behavior patterns from production history.
The practical consequence is that the majority of black-box debugging does not require seeing the other side. 87% of root causes were on the caller's side. 87% of simulated diagnoses matched the confirmed root cause. The escalation reflex is often a reflection of diagnostic tooling limitations rather than a genuine need for information from the other side.
The Sim-1 engine's ability to operate under partial observability extends code simulation into a domain that we expect to improve as production world models deepen. Each resolved issue feeds back into the model's knowledge of how specific integrations behave. The 87% match rate reflects models that have accumulated months of production history. For newer deployments, the rate will be lower. For mature deployments, we expect it to be higher.
We plan to publish follow-up work examining match rate by specific integration type, measuring accuracy improvement over deployment tenure, and evaluating simulated traces as a form of synthetic observability for permanently unobservable components.
Request access at playerzero.ai/get-started.