Predicting production-facing risk from code changes before they ship
Today, we are publishing findings from a three-month study of production-facing risk at the PR stage. Across 26,400 PRs spanning 3,614 repositories, approximately 30 billion lines of code, and engineering organizations totaling 55,000 engineers and 10,000 QA professionals, we used PlayerZero's AI production engineer to simulate real production scenarios against proposed code changes before they merged.
The core question: when the AI production engineer simulates a production scenario against a PR and that simulation fails, does the failure actually show up as a customer ticket?
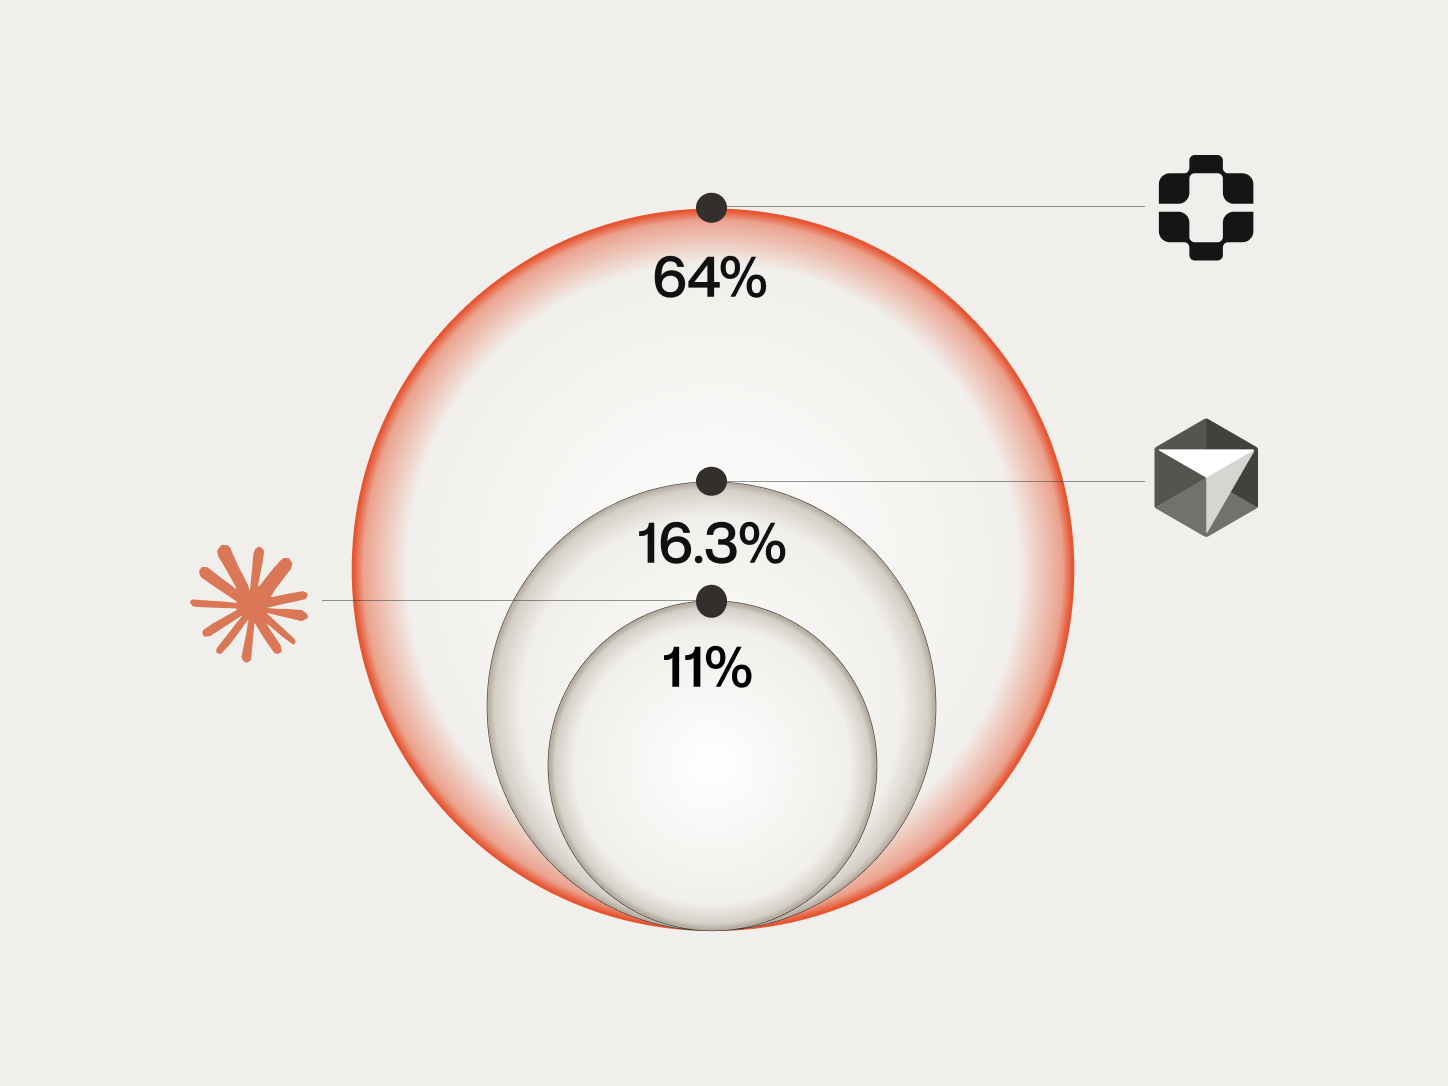
The answer: 64% of the time, it does. Of the scenarios PlayerZero selected, simulated, and flagged as failing at the PR stage, 64% corresponded to real customer-reported tickets filed within 30 days of the code merging.
To our knowledge, this is the first study that connects pre-merge simulation failures to downstream production tickets at scale. Only PlayerZero has this data, because only PlayerZero runs production-aware simulations at the PR stage.
This work builds directly on our Sim-1 research, which introduced code simulation as a method for reasoning about codebase behavior without compilation or execution. Since publishing that work, we have executed approximately 750,000 simulations across production environments. The study described here represents a specific application of that simulation infrastructure to the pre-merge prediction problem, and the results reflect both the maturation of the simulation engine and the depth of the production world models we have built over that period.
Key findings
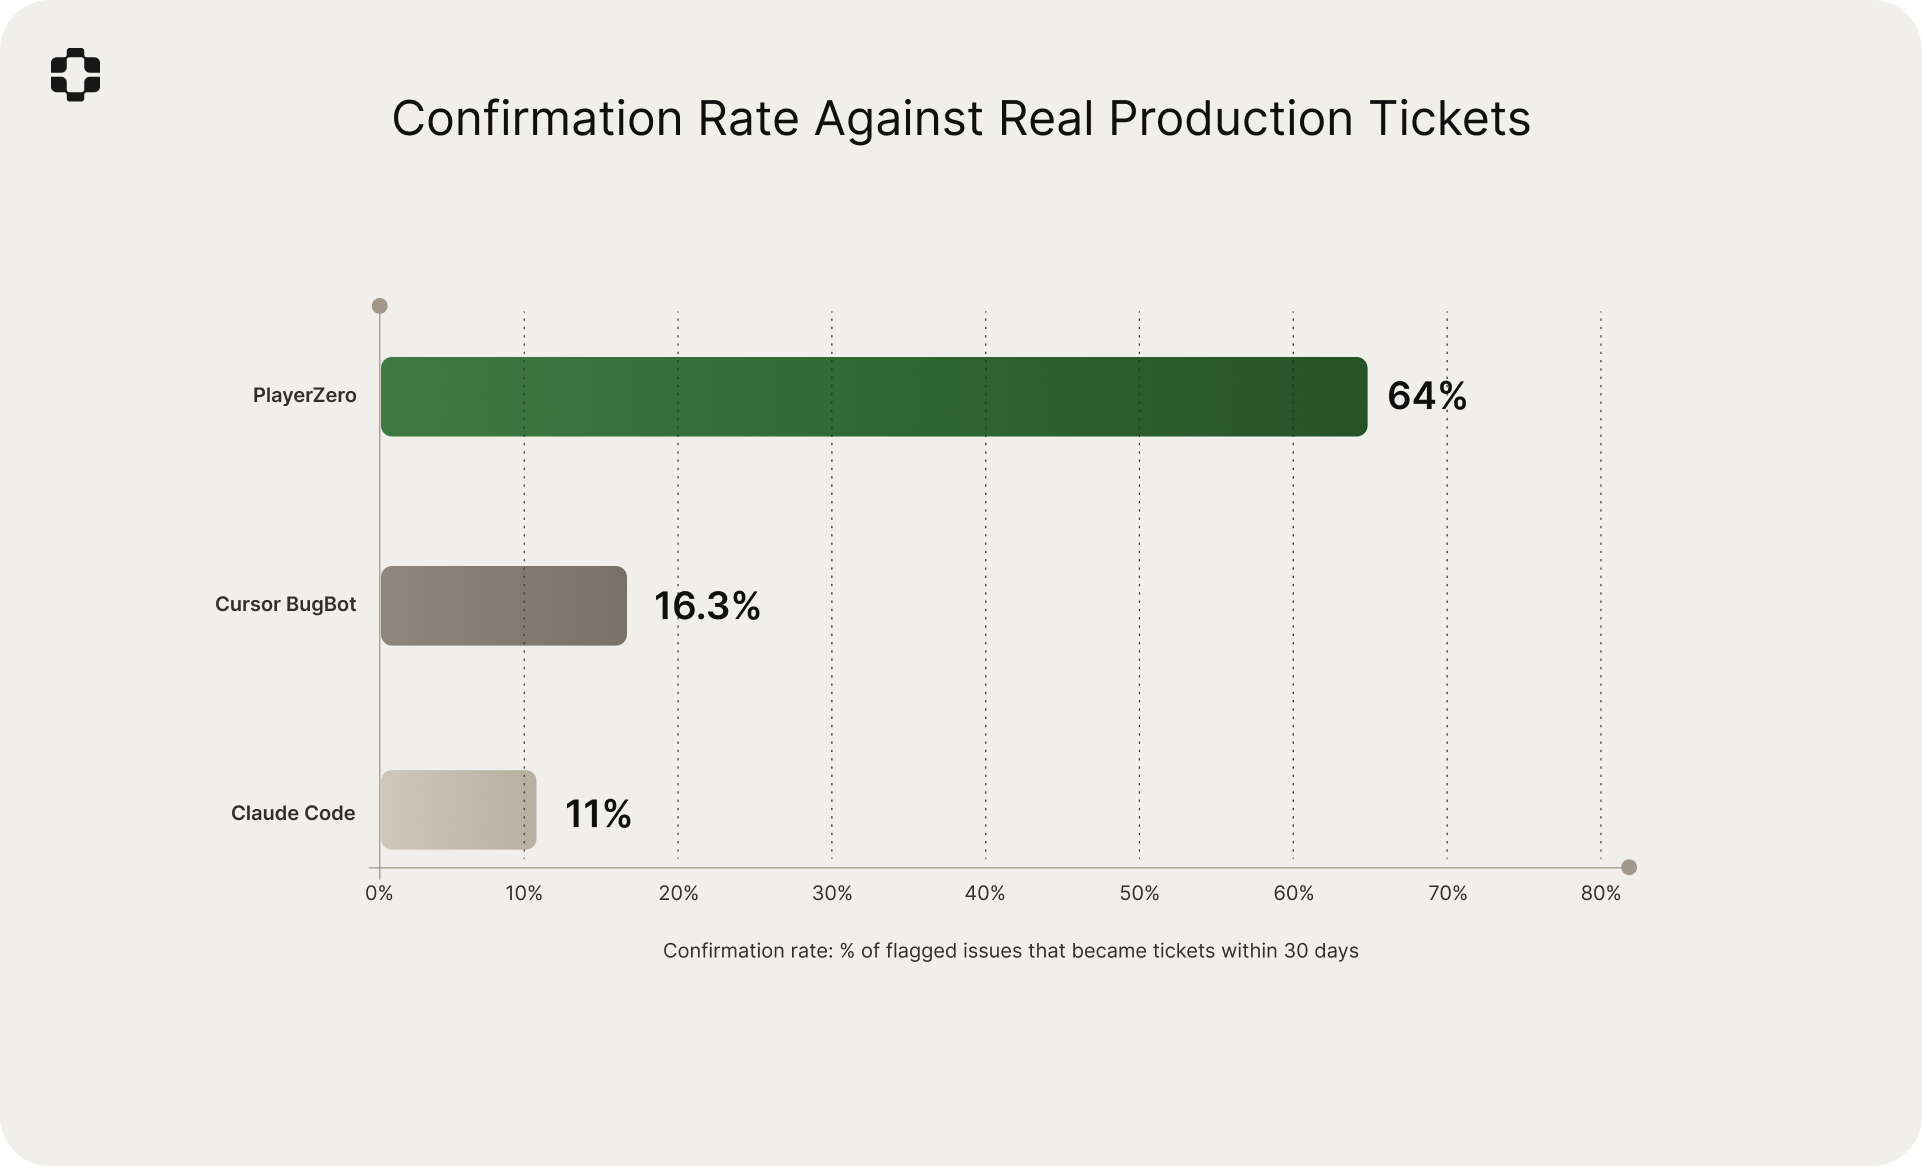
- 64% confirmation rate. Of the scenarios PlayerZero flagged as failing at the PR stage, 64% became real customer tickets within 30 days. For companies with 6+ months of production history, the rate was 71%.
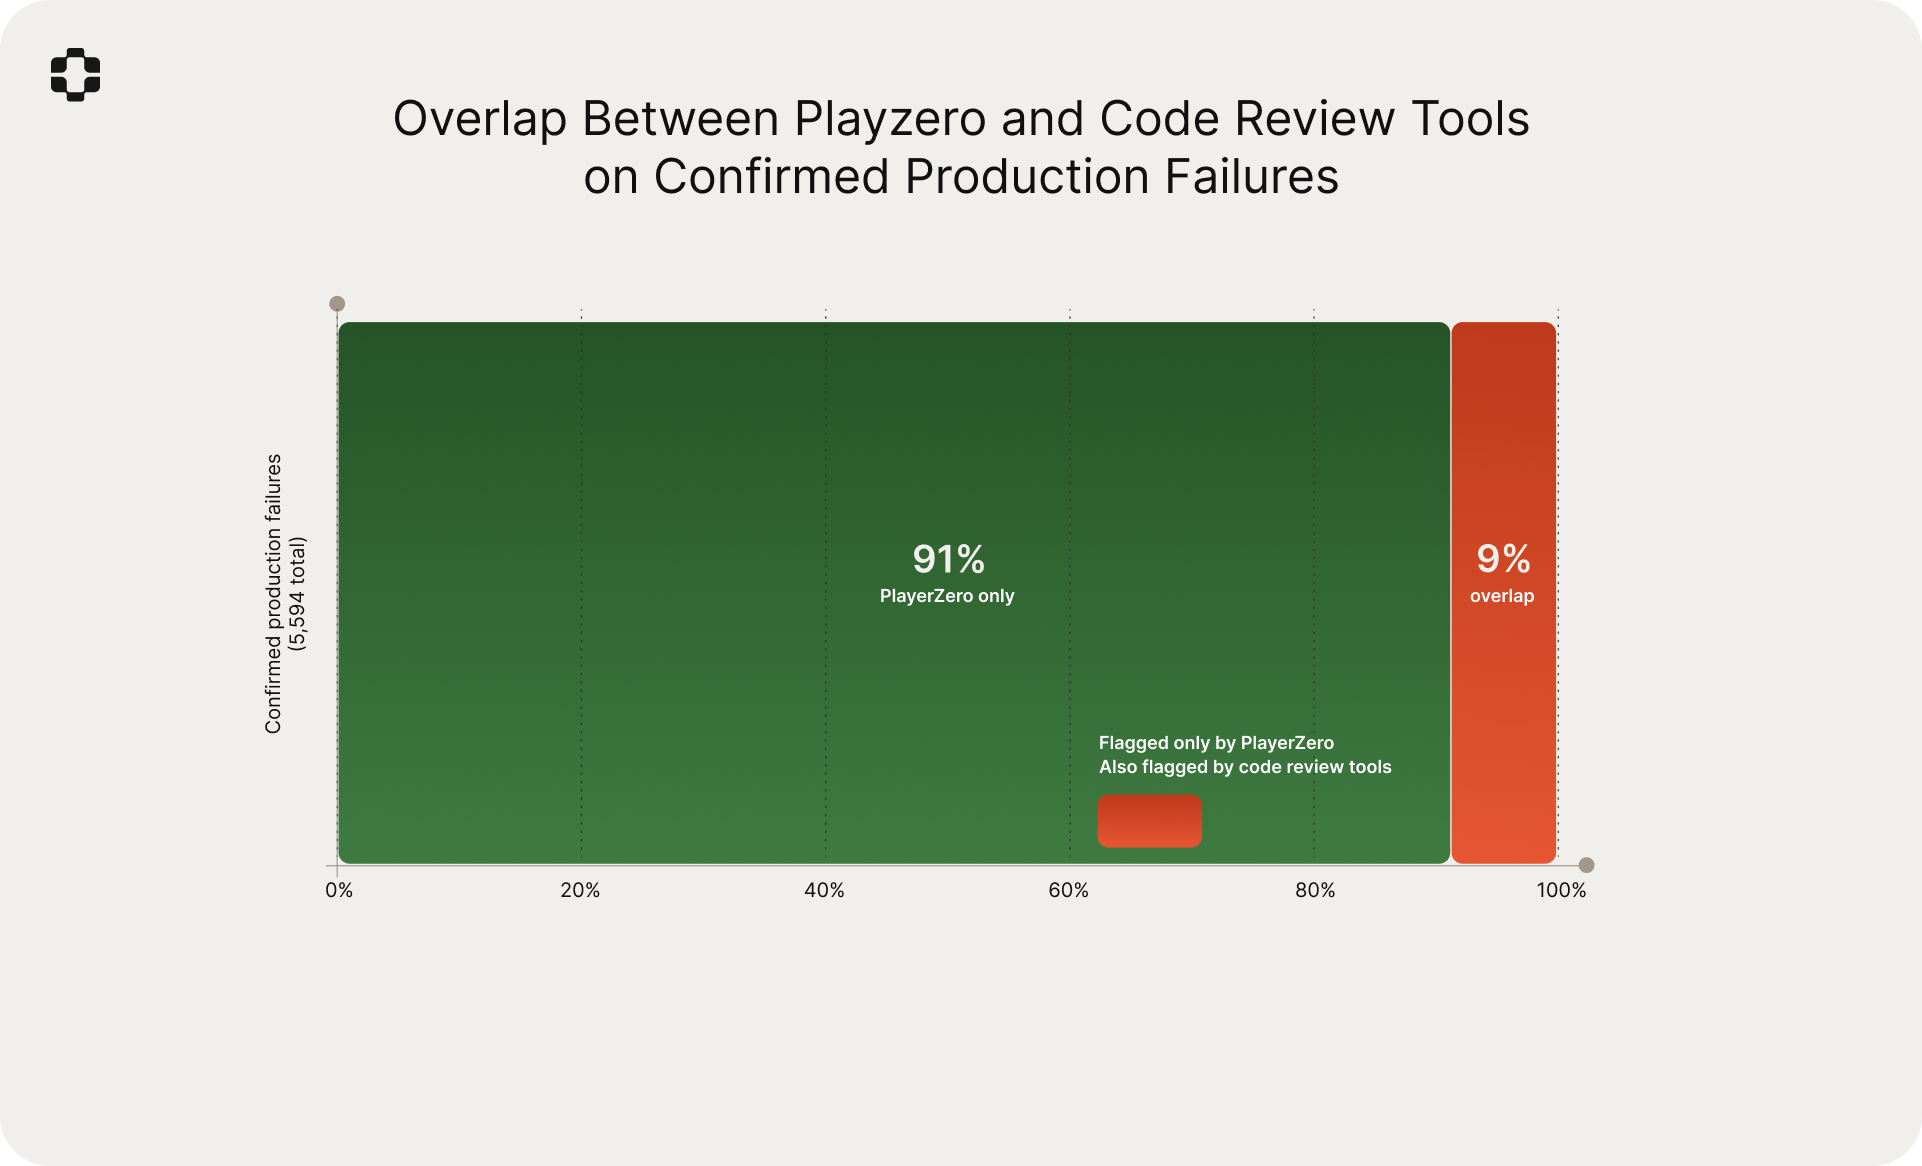
- 9% overlap with code review tools. Of the confirmed production failures PlayerZero identified, only 9% were also flagged by Claude Code or Cursor BugBot. The tools are operating on almost entirely different information.
- 83% of confirmed failures were invisible to existing workflows. They passed all CI/CD checks and were not flagged by any code review tool. The only signal was a customer ticket days later.
- 63% of failures were correct code in the wrong context. The dominant failure mode is not buggy code. It is correct code colliding with production conditions the developer did not know about.
- 8% of repositories generated 61% of production tickets. Risk is concentrated in a small number of code areas, and they are rarely the areas engineering teams consider "high risk."
- Reviewer seniority does not predict catch rate. PRs approved by staff+ engineers had the same regression rate as PRs approved by mid-level engineers. The information gap is structural.
- Deploy density matters more than deploy day. The "never deploy on Friday" convention had no statistical support. But 6+ PRs to overlapping services within 24 hours increased regression rate 4.1x.
- The first ticket from a code area predicts the next three. A 72% probability that a code area generating one ticket will produce 2+ more within 60 days.
These are large, real, brownfield codebases
Before going further, it is worth emphasizing what this dataset represents. These are not demo environments or greenfield projects. They are mature B2B SaaS systems with years of accumulated complexity: legacy modules, custom integrations, multi-tenant configurations, migration artifacts, and the full weight of real production history.
The codebases in this study range from 400,000 to 1.2 billion lines of code. The median repository has been under active development for over four years. Many contain services written in multiple languages, maintained by teams that have turned over several times, and shaped by customer-specific configuration that no single engineer fully understands.
This matters because production-aware simulation is most valuable where systems carry the most accumulated context and hidden interaction effects. A clean, well-tested greenfield project has relatively few of these. A seven-year-old platform serving hundreds of enterprise customers with unique configurations, feature flag states, and integration patterns has thousands. The systems in this study are firmly in the latter category.
It is also worth noting that these are the environments where production problems are most expensive. The systems are large enough that root-cause attribution after the fact is difficult. The customer base is diverse enough that a change affecting one configuration may be invisible to another. And the development velocity is high enough that by the time an issue surfaces as a ticket, multiple subsequent PRs have merged on top, making the causal chain harder to trace.
The gap between code quality and production safety
A PR can pass every CI check, receive senior engineering approval, and still generate customer tickets. This is well understood in principle. The data makes it concrete.
Of the PRs in our dataset that went on to generate tickets within 30 days, 78% had passed all CI/CD checks and received at least one human approval before merging. The tests passed. The reviewers approved. The code was, by every available measure, ready to ship.
The reason is straightforward: the risk in most production-facing regressions is not in the code itself. It is in the interaction between the code change and production conditions that the development workflow has no visibility into. Customer-specific configurations, unusual data shapes, feature flag combinations that have never been tested together, downstream system behaviors, integration patterns maintained by customer IT teams. The code was correct. The assumptions about the environment it would run in were not.
Baseline: how AI code review tools perform on this task
Tools like Claude Code and Cursor BugBot represent a meaningful step forward in AI-assisted code review. They analyze diffs, identify potential bugs, flag anti-patterns, and catch classes of issues that human reviewers miss.
But they are answering a different question. They ask: "is there a problem in this code?" The question we are interested in here is different: "will this change create customer-reported problems in production?"
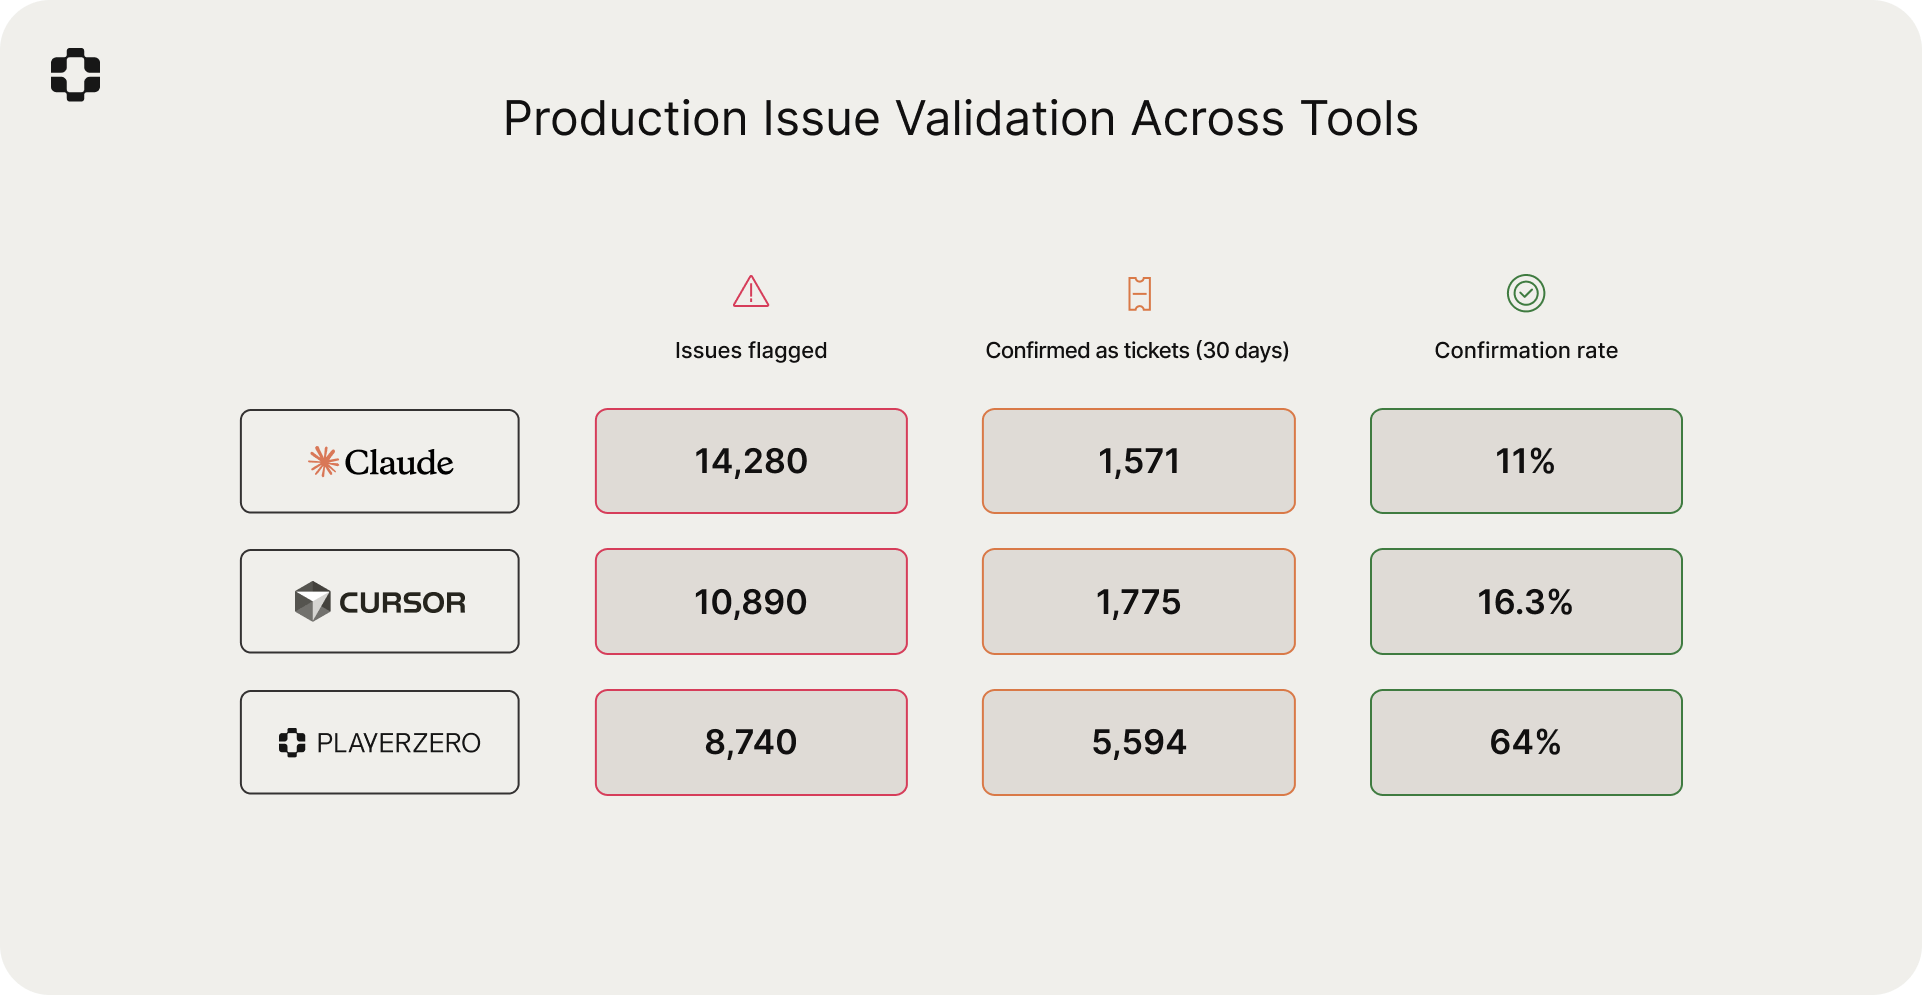
To measure the difference, we ran the same 26,400 PRs through PlayerZero's production simulation alongside Claude Code and Cursor BugBot. For each tool, we tracked the same outcome: of the issues flagged, how many corresponded to real customer tickets within 30 days?
More notable is the overlap. Of the 5,594 confirmed production-facing failures that PlayerZero identified, only 9% were also flagged by either code review tool. The tools are surfacing almost entirely different categories of problems.
Why the gap exists
The difference in confirmation rate is not a matter of model capability. Claude Code and Cursor BugBot use strong models and sophisticated analysis. The difference is in what each tool operates on.
Code review tools analyze the diff. They see what changed, reason about whether the new code is correct, and compare against learned patterns of common bugs. This is static analysis with LLM-grade reasoning. It catches real issues. But it is bounded by what is visible in the diff and the model's general knowledge of software patterns.
PlayerZero operates on a different input. Instead of analyzing the change in isolation, it simulates the change against a model of how production actually behaves. This model, which we call the production world model, is a continuously evolving graph built from the codebase, historical tickets, incident data, deployment history, customer configurations, and runtime signals. It represents what the system actually does in the real world.
When PlayerZero evaluates a PR, it maps the change onto this graph to understand what production surfaces the change touches. Then it selects relevant production scenarios (real customer workflows, historical failure patterns, known edge cases derived from past tickets) and simulates whether the proposed change would cause failures in those scenarios.
The simulation engine is the same Sim-1 system we published previously, which achieves 92.6% simulation accuracy across 2,770 production scenarios and maintains coherence across 30+ minute traces and 50+ service boundaries. Since that publication, the system has been refined through approximately 750,000 production simulations, and the production world models it operates on have deepened considerably through continuous exposure to real tickets, incidents, and deployments.
The 9% overlap with code review tools is, in our view, the most important number in this comparison. It quantifies what is intuitively obvious but rarely measured: the information needed to predict production failures is almost entirely absent from the code diff. A code review tool might catch a null pointer visible in the diff. PlayerZero catches the scenario where a specific healthcare customer's hybrid role migration state, combined with a provider type that exercises a legacy lookup path, will cause traveling nurses to lose access to patient records. That knowledge does not exist in the diff. It exists in the production world model.
Study design
Dataset. 26,384 PRs across 3,614 repositories (approximately 30 billion lines of code) from 14 B2B SaaS companies over a three-month period from September through November 2025. These systems are managed by a combined 55,000 engineers and 10,000 QA professionals. Companies span healthcare, financial services, enterprise supply chain, telecommunications, and developer tools, ranging from Series B to public.
Scenario selection. For each PR, the AI production engineer selected and simulated a median of 12 production scenarios based on relevance to the change surface. Scenarios were drawn from the production world model, derived from historical tickets, incidents, and learned production behavior. Total scenarios simulated across the study: approximately 317,000.
Outcome tracking. A failed simulation was matched to a downstream ticket if: (a) a ticket was filed within 30 days of the PR merging, (b) automated root-cause analysis linked the ticket to the code area or behavior modified by the PR, and (c) the failure mode was consistent with the simulated scenario. Attribution was validated through automated root-cause analysis across the full dataset, with manual engineering review on a 15% validation sample.
Comparison tools. Claude Code and Cursor BugBot were configured with default settings and run against the same 26,400 PRs. Each tool's flagged issues were tracked through the same 30-day outcome window and attribution methodology.
Primary metric. The confirmation rate: of the scenarios that PlayerZero simulated and flagged as failing at the PR stage, what percentage materialized as real customer tickets within 30 days?
Results
Confirmation rate: 64%
Of the 8,740 scenarios flagged as failing during PR-stage simulation, 5,594 (64%) corresponded to confirmed customer tickets within 30 days.
Time to ticket
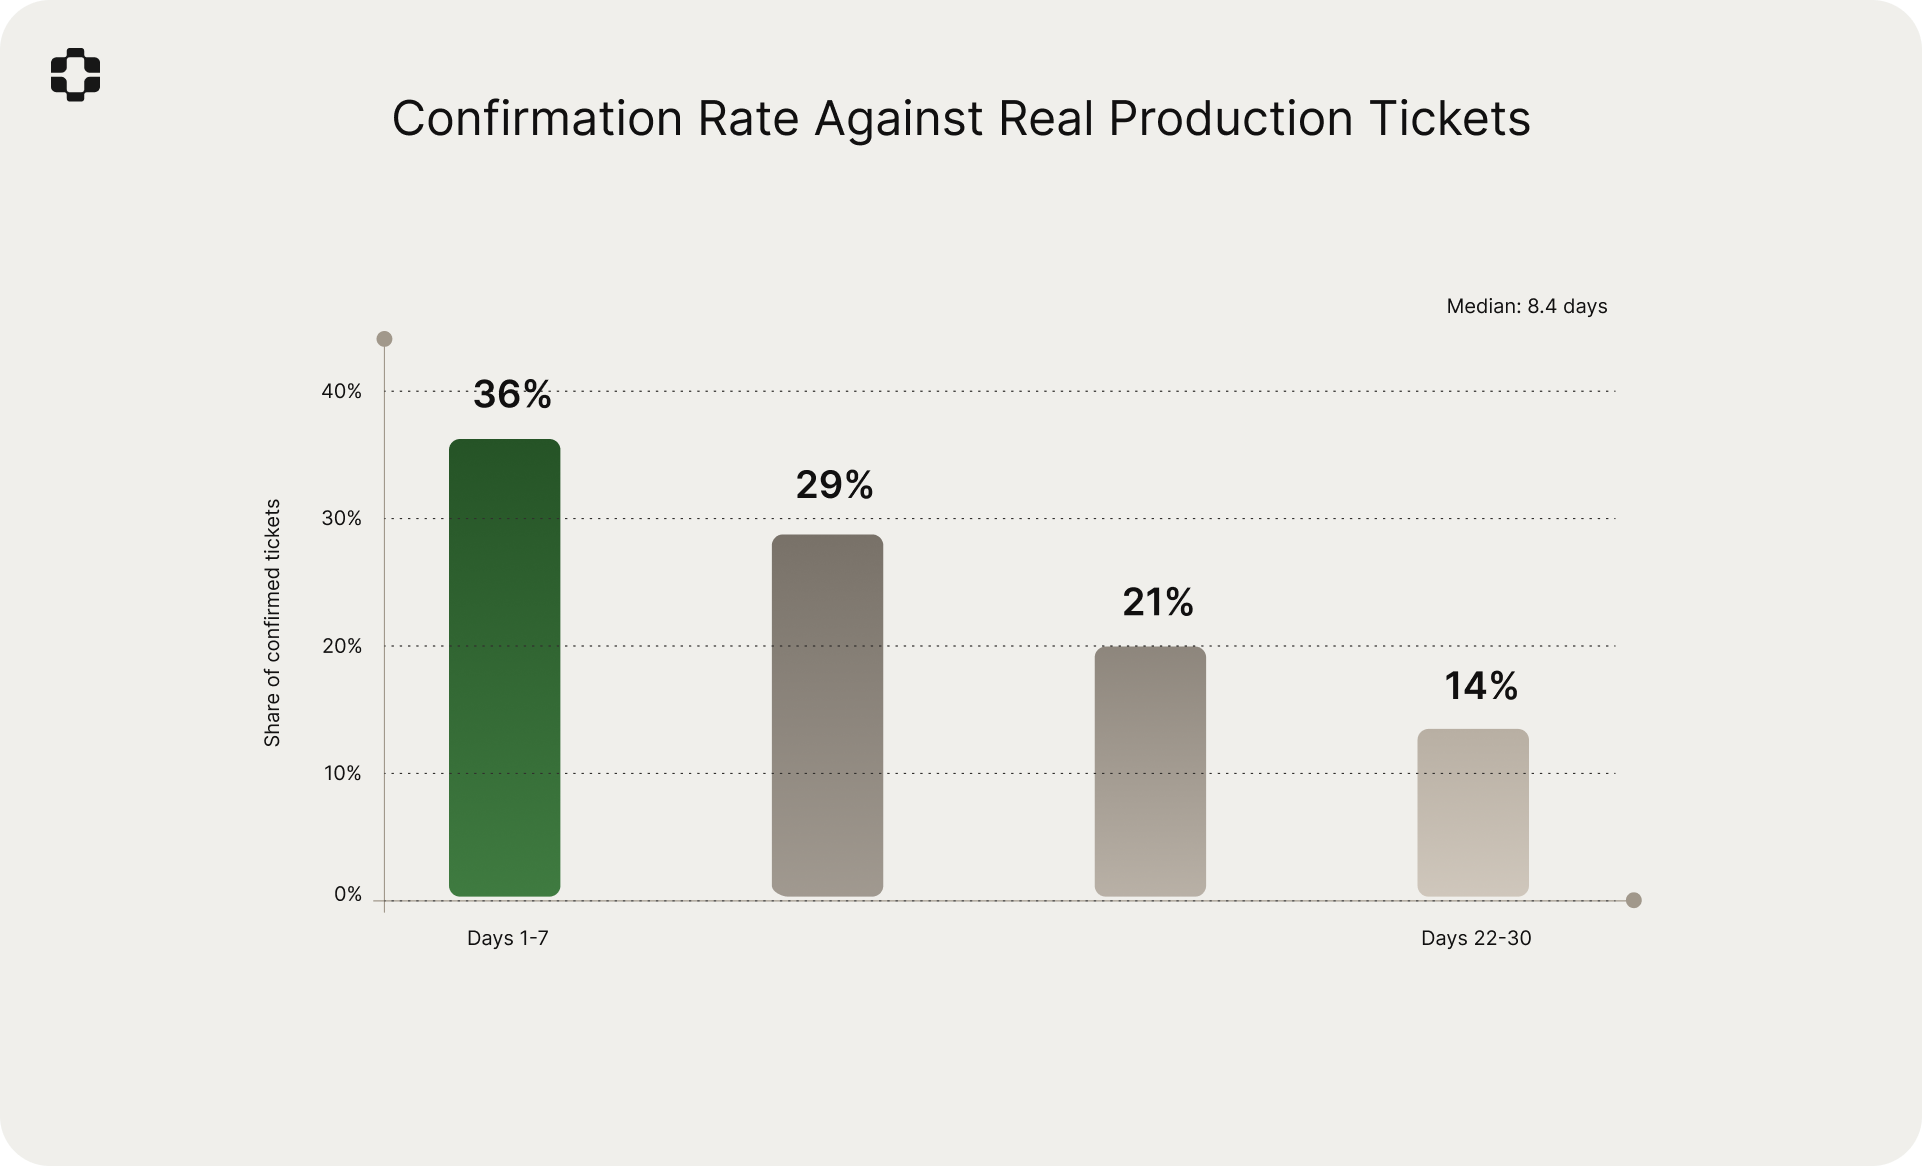
Of the 5,594 confirmed failures, the distribution of time from merge to first ticket was:
- Week 1 (days 1-7): 36% of confirmed tickets
- Week 2 (days 8-14): 29%
- Week 3 (days 15-21): 21%
- Week 4 (days 22-30): 14%
Median time from merge to first ticket: 8.4 days. The concentration in weeks one and two is expected: the most exercised code paths surface failures quickly, while edge cases and lower-traffic flows take longer to manifest.
Failure categories
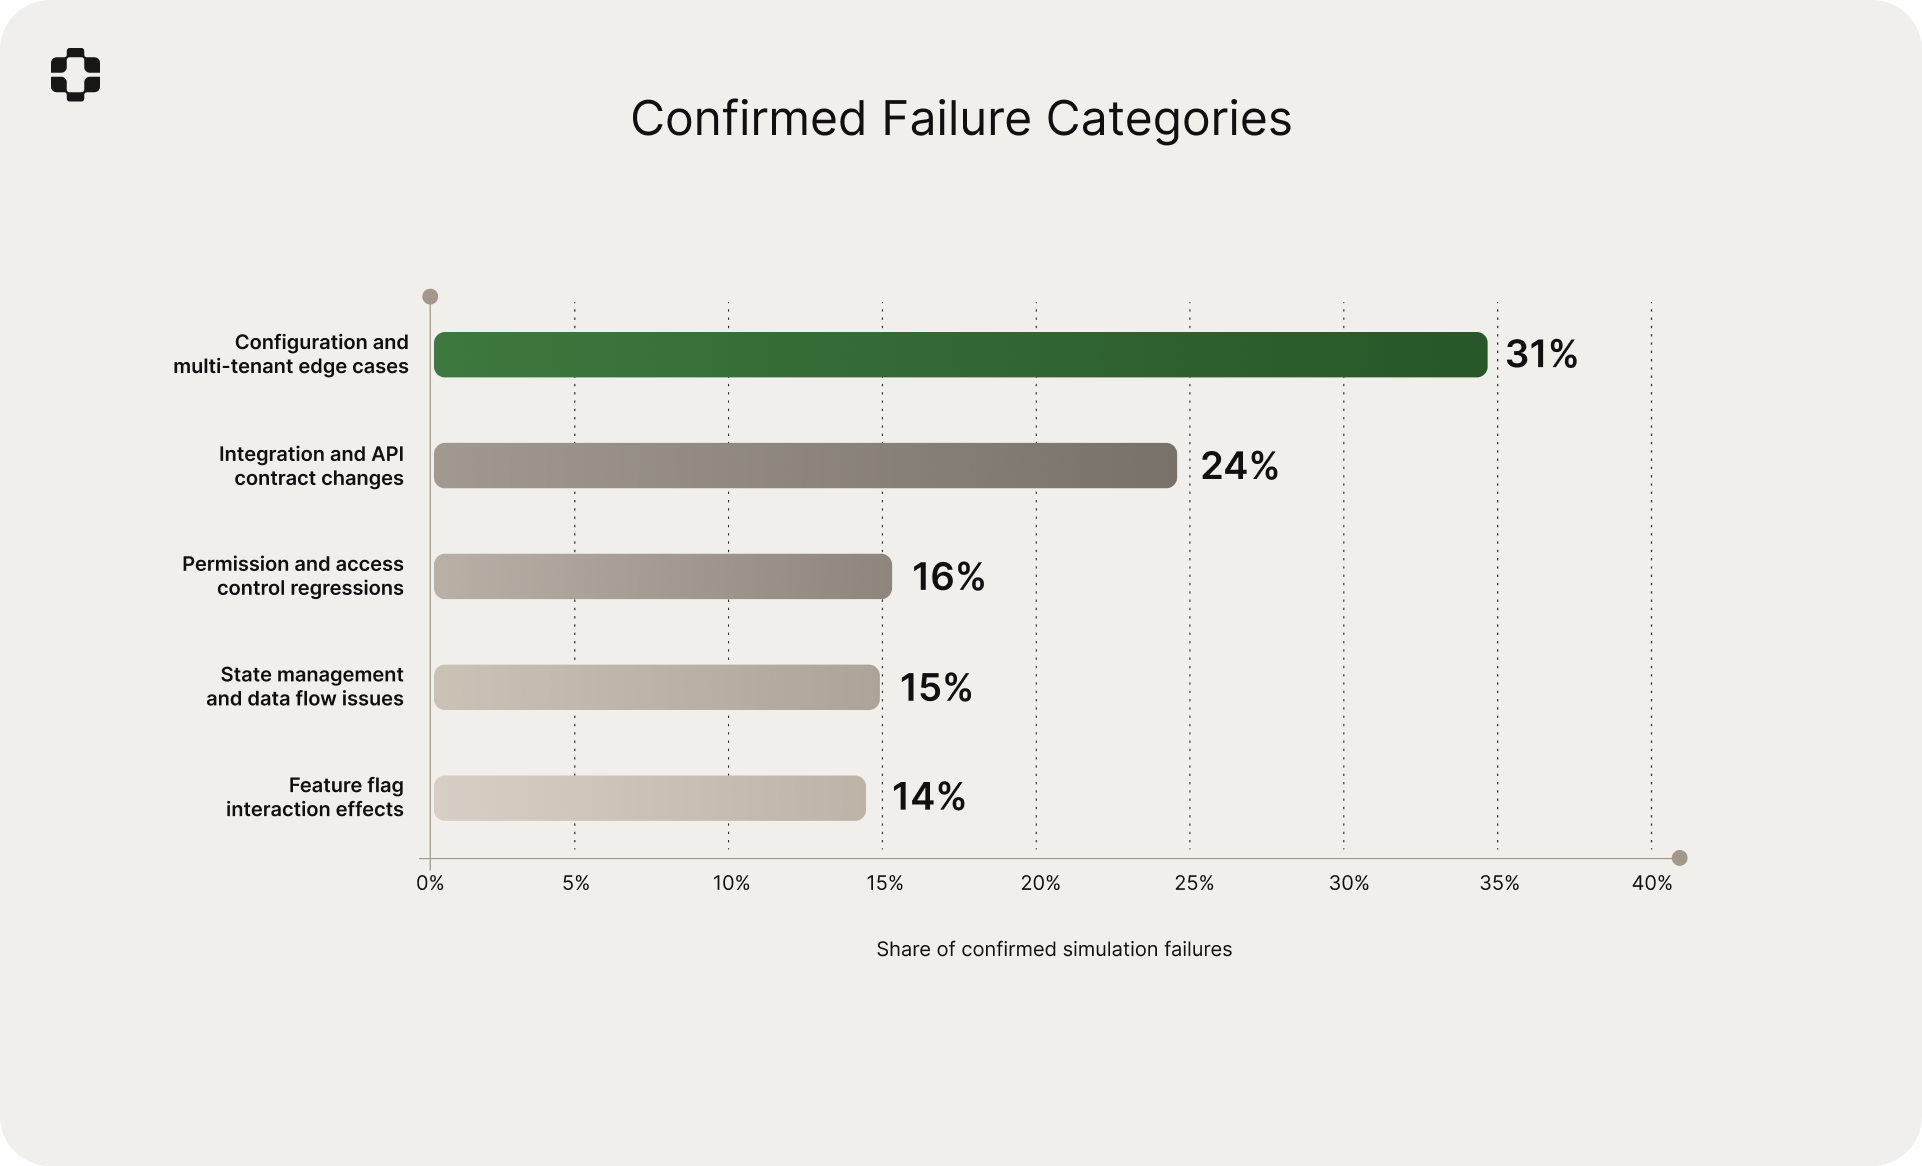
The most common categories among confirmed simulation failures:
- Configuration and multi-tenant edge cases: 31%
- Integration and API contract changes: 24%
- Permission and access control regressions: 16%
- State management and data flow issues: 15%
- Feature flag interaction effects: 14%
Invisible failures
Of the 5,594 confirmed production-facing failures, 71% were in PRs that passed all existing CI/CD checks. 83% were not flagged by either Claude Code or Cursor BugBot. These are regressions that were invisible to the standard development workflow: no test caught them, no reviewer flagged them, no code review bot identified them.
Compounding accuracy
The confirmation rate improved as the production world model accumulated more history. Companies where PlayerZero had been operating for six or more months had a confirmation rate of 71%, compared to 54% for companies in their first month.
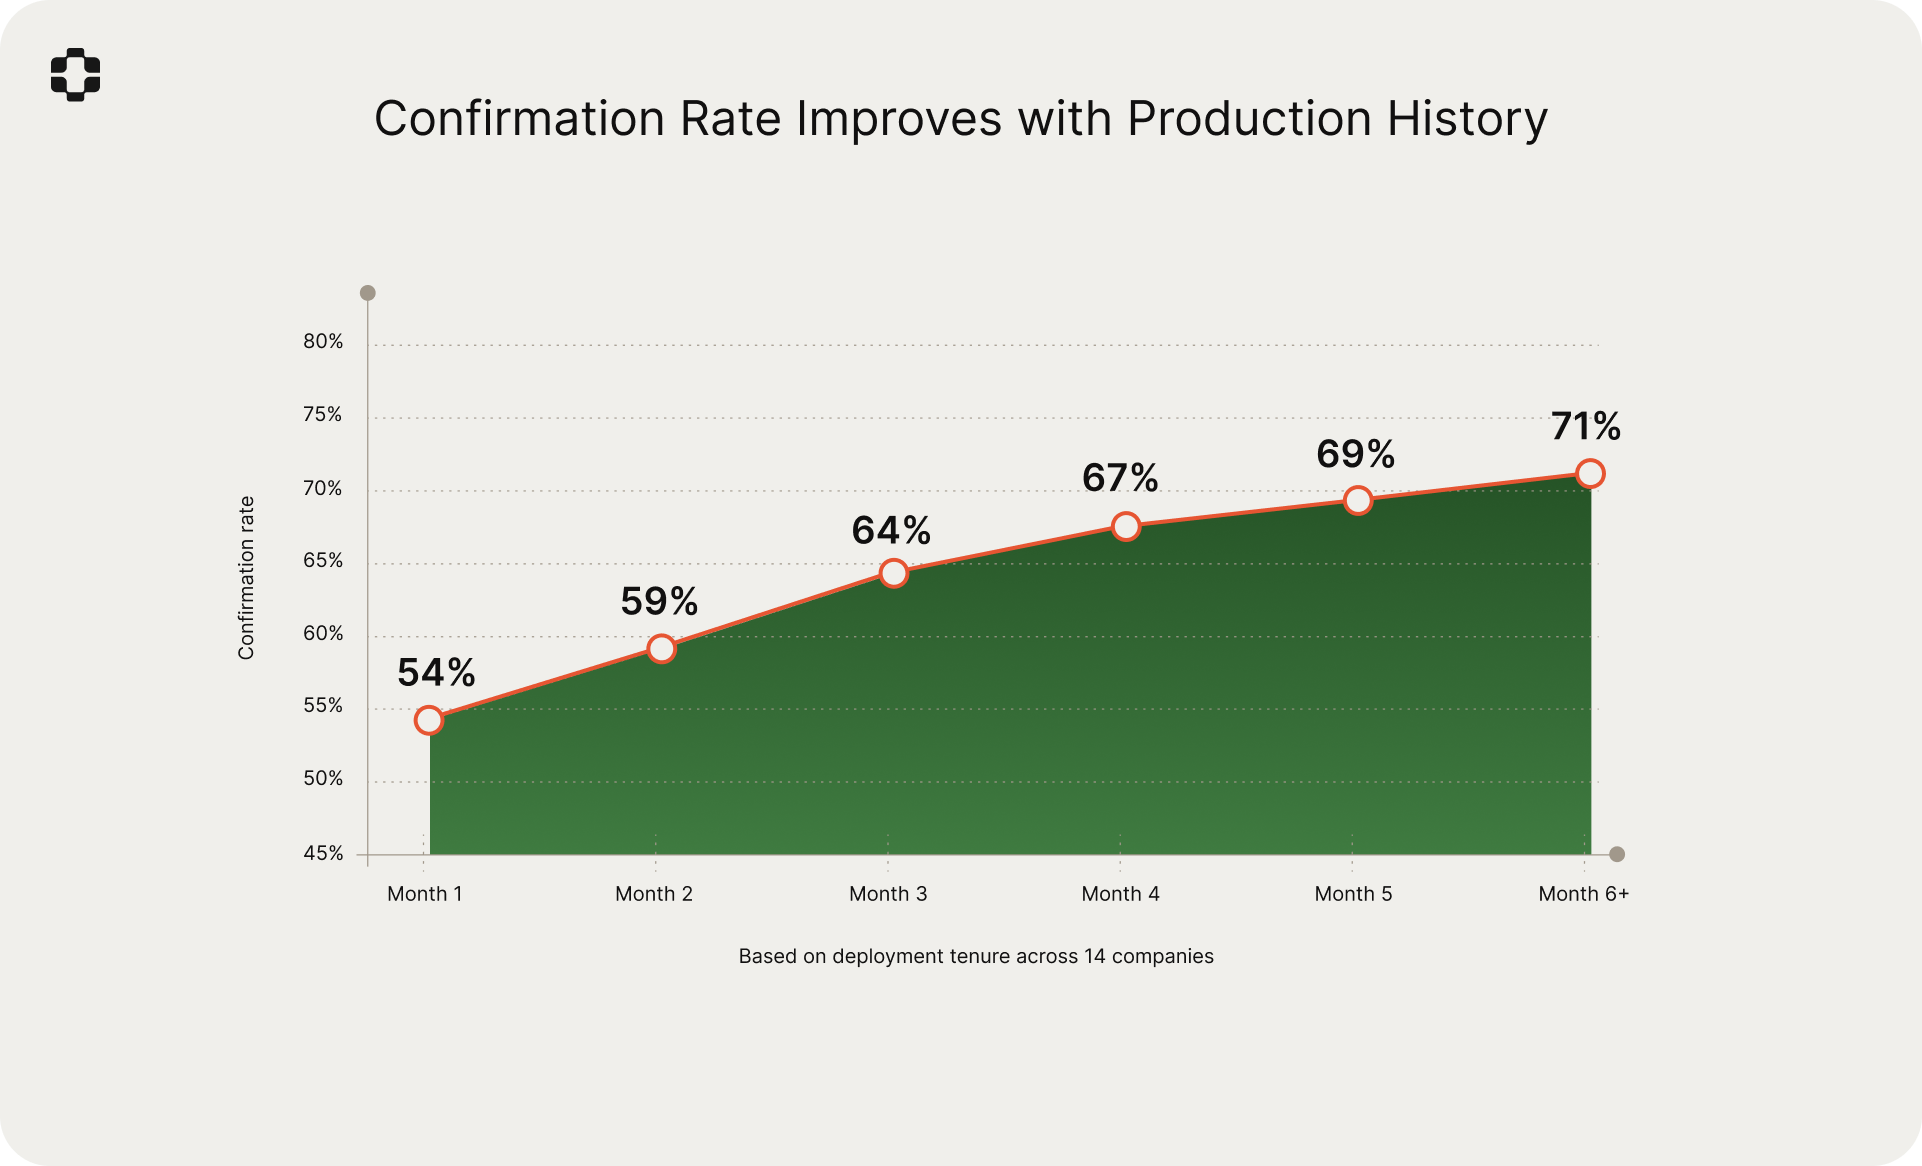
This is consistent with the compounding dynamics we described in the Sim-1 paper. Each resolved ticket, each investigated incident, and each simulation result feeds back into the production world model, refining its understanding of how the system actually behaves. The model learns which code paths matter to which customers, which configurations cause which failures, and which changes tend to break which flows. The improvement from 54% to 71% over six months quantifies this effect directly.
Representative scenarios
The following are anonymized examples drawn from the study. Each illustrates the same pattern: code that is correct, passes tests, and receives approval, but breaks a real production workflow visible only through the production world model.
Healthcare: patient record access after role migration
A 12-facility health system in the Midwest.
The PR. A routine refactor of the role-based access control module, simplifying how provider roles were resolved during session initialization. All existing RBAC tests passed.
What the simulation flagged. The production world model knew that this customer had migrated provider roles in a phased rollout six months earlier, leaving some accounts in a hybrid state where the legacy role mapping was still the active path for certain provider types. Specifically, traveling nurses with multi-facility access still resolved through the old lookup chain. The simulation predicted that these providers would fail session initialization under the new logic, falling back to a default role with reduced permissions. They would authenticate successfully but lose access to patient records at their assigned facilities.
What happened. Eleven days after the PR merged, the health system filed a P1 ticket. Traveling nurses across three facilities were locked out of patient records mid-shift. The issue was initially triaged as an infrastructure problem, and root cause was not identified for four days because the RBAC refactor had passed all tests and the symptom (reduced permissions, not total failure) did not immediately point to the code change.
Why code review missed it. The diff was a clean simplification of a lookup chain. The risk existed entirely in a customer-specific migration state, for a specific provider type, following a specific onboarding path from six months prior. None of that information exists in the code.
Financial services: settlement calculation under multi-currency batching
A large institutional trading platform serving global financial clients.
The PR. An optimization to the settlement calculation pipeline that batched currency conversion API calls to reduce latency. The new implementation was functionally equivalent to the previous sequential approach according to unit and integration tests. Two senior engineers reviewed and approved.
What the simulation flagged. The production world model had learned from historical incidents that a specific class of institutional clients processed trades settling across three or more currencies in a single batch. The simulation predicted that the new batching logic would change the order of conversion operations, and that under the previous sequential model, rounding behavior had been deterministic in a way that the batched version was not. For multi-currency settlement batches above a certain size, cumulative rounding differences would cause the settlement total to diverge from the expected amount by fractions of a cent, triggering automated reconciliation alerts downstream.
What happened. Six days post-merge, the operations team at a major institutional client began seeing reconciliation discrepancies on cross-currency settlements. The amounts were small (sub-cent per transaction) but the automated reconciliation system flagged them, triggering a compliance review. Engineering time to diagnose the root cause: five days, because the optimization was verified as "functionally equivalent" and no one suspected it.
Why code review missed it. The code was correct. The batching optimization was genuinely equivalent for the vast majority of cases. The failure required the intersection of multi-currency batches, specific rounding behavior in the conversion API, and the downstream reconciliation system's tolerance thresholds. That chain spans three systems and years of production history.
Enterprise supply chain: inventory sync under strict schema validation
A major automotive parts distributor with 14 distribution centers.
The PR. A change to the inventory synchronization service adding a partitioning key to the sync payload, enabling inventory updates to be routed to specific warehouse zones. All existing sync tests passed. The new feature worked correctly in staging.
What the simulation flagged. The world model knew that several large manufacturing customers had configured their inventory sync with custom middleware that parsed the sync payload using a strict schema validator. This middleware predated the current API version and was maintained by the customer's internal IT team. The simulation predicted that adding the new partitioning key would cause the middleware's strict validator to reject the payload as malformed, silently dropping inventory updates for those warehouses.
What happened. Four days post-merge, the automotive distributor reported that inventory counts at three distribution centers had stopped updating. The customer was running just-in-time inventory, and the stale counts caused simultaneous over-ordering and stockouts. The customer's middleware was silently dropping the payloads with no error and no alert. Only the absence of data, noticed operationally, surfaced the problem.
Why code review missed it. The PR was purely additive. It added a field to a payload without changing any existing behavior. The risk was entirely in how a downstream system, specifically customer-managed middleware with strict schema validation, would react to the new field. That system is not in the vendor's codebase. It is in the production world model.
Telecommunications: call routing degradation during cache warming
A Fortune 500 enterprise telecom provider with 30,000+ seats.
The PR. A performance improvement to the call routing engine that added a local cache for carrier preference lookups, reducing database load during peak hours. The implementation included proper cache invalidation on preference updates. Load testing showed a 40% reduction in lookup latency.
What the simulation flagged. The production world model had learned that a subset of enterprise customers had configured aggressive carrier failover rules: if primary carrier latency exceeded a threshold, the system would automatically fail over to a secondary carrier within milliseconds. The simulation identified that during cache warming (the first minutes after deployment or cache flush), carrier preference lookups would return stale data for recently updated failover configurations. For customers with aggressive failover thresholds, this would route calls through a carrier that had been explicitly deprioritized, often due to known quality issues in specific regions.
What happened. Nine days post-merge, following a routine deployment that flushed the cache, the enterprise customer reported degraded call quality across their Southeast Asian operations. Calls were routed through a carrier the customer had deprioritized months earlier due to quality issues in that region. The routing corrected itself after the cache warmed (approximately 14 minutes), but the window of degraded service affected over 2,200 calls.
Why code review missed it. The caching implementation was textbook correct, including invalidation logic. The failure was a transient state (cache warming) interacting with a customer-specific configuration (aggressive failover thresholds) and a business decision (carrier deprioritization for regional quality reasons). Each layer of context sits further from the code and closer to production reality.
Observations across the dataset
Beyond the primary findings, several patterns emerged that generalize across companies and industries. Some of these were expected. Others were not.
Production risk is concentrated, not distributed
Across the full dataset, 8% of repositories accounted for 61% of confirmed simulation-to-ticket matches. Production risk is not spread evenly across a codebase. A small number of code areas are responsible for a disproportionate share of customer-reported problems.
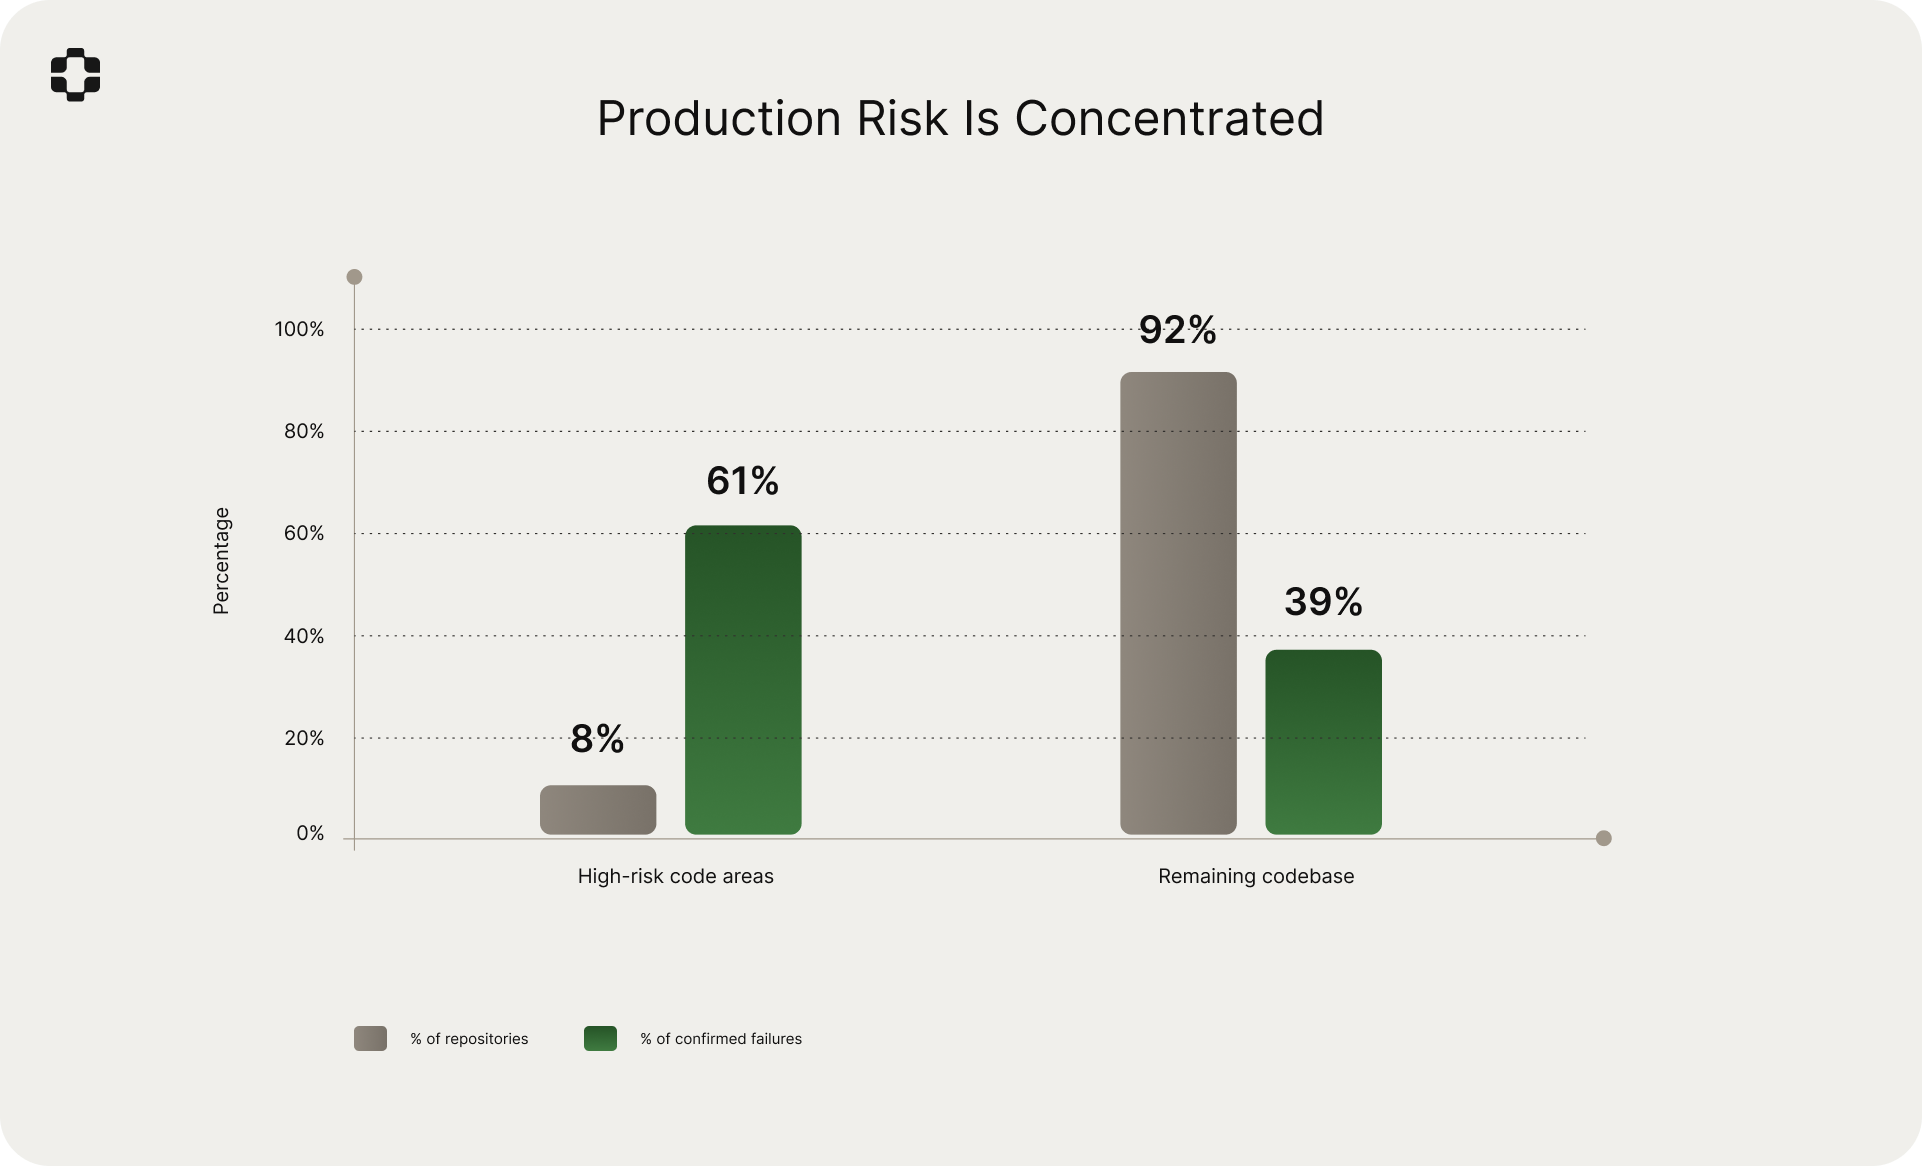
In most cases, these areas were not the ones engineering teams would have identified as "high risk." They were configuration layers, permission logic, and integration glue code that teams treated as stable precisely because changes to them were infrequent. The production world model identifies these areas because it has learned from the ticket history where problems actually originate. We observed significant divergence between engineering intuition about risk and the empirical distribution of production failures.
Test coverage is inversely correlated with production risk
This was counterintuitive. The code areas with the highest test coverage had the lowest rate of confirmed production-facing regressions. That much is expected. But the inverse held more strongly than anticipated: the code areas generating the most production tickets had, on average, 3.8x fewer tests per line of code than the codebase median.
This is not because engineers were negligent about testing. It is because the riskiest areas are inherently difficult to test with conventional methods. Configuration resolution logic, multi-tenant branching paths, integration glue between services, and permission evaluation chains all depend on runtime context that unit and integration tests do not replicate. The areas that are hardest to test are the areas where production context matters most, and therefore the areas where the most tickets originate. Traditional test coverage metrics do not capture this dynamic.
Reviewer seniority does not predict catch rate
PRs reviewed by staff or principal engineers were no more likely to avoid confirmed production regressions than PRs reviewed by mid-level engineers. The confirmation rate for PRs approved by senior reviewers (staff+ level) was 6.1%, compared to 5.8% for PRs approved by mid-level reviewers. The difference is not statistically significant.
This suggests that the information gap underlying production-facing regressions is not a skill gap. Even the most experienced engineers on the team cannot evaluate production risk from the diff, because the necessary context is not present in the diff. Seniority helps with code quality and architectural judgment. It does not help with predicting how a customer's unusual SSO configuration will interact with a refactored auth module, because that information lives in production history, not in the code.
The "one more thing" pattern
PRs that bundled an incidental change alongside a primary feature change were 2.4x more likely to produce confirmed production regressions. In 81% of these cases, the regression came from the incidental change, not the primary one.
The pattern is consistent: an engineer working on a feature notices an adjacent cleanup opportunity (a small refactor, a config adjustment, a deprecated parameter removal) and includes it in the same PR. Reviewers focus their attention on the primary change and approve the incidental change with minimal scrutiny. The incidental change then interacts with production context that nobody considered.
This pattern accounted for 18% of all confirmed failures in the dataset. It is one of the few findings that suggests a straightforward process change (splitting incidental changes into separate PRs) could measurably reduce production risk even without simulation.
Deploy day does not matter, but deploy density does
Contrary to the widespread "never deploy on Friday" convention, the day of the week had no statistically significant correlation with production regression rate. Monday through Friday confirmation rates were within 1.2 percentage points of each other.
What did correlate was deploy density. When more than six PRs merged within a 24-hour window touching overlapping services, the regression rate increased 4.1x compared to the baseline. The mechanism is intuitive: overlapping changes to the same service create interaction effects that are not visible in any individual PR. Each PR was reviewed and tested in isolation, but the combined effect of multiple concurrent changes created a state that no individual author anticipated.
This suggests that deploy cadence policies (which day to ship) are less important than deploy coordination policies (how many concurrent changes to the same surfaces are acceptable within a window).
The first ticket from a code area predicts the next three
When a code area generated its first confirmed production ticket during the study period, there was a 72% probability that the same code area would generate at least two more tickets within 60 days from different PRs. Areas that generated one ticket averaged 3.4 tickets over the study period.
Failure begets failure, and the reason is structural. The conditions that make a code area prone to production regressions (deep context-dependence, customer-specific configuration, weak test coverage, integration complexity) persist across PRs. A single ticket is a signal that the production world model has learned to take seriously: it indicates a code area where the gap between what engineers know and what production does is wide, and where subsequent changes carry elevated risk.
Most confirmed failures are correct code in the wrong context
Only 14% of confirmed failures were actual logic bugs, cases where the code did not do what the developer intended. The majority, 63%, were code that worked correctly in isolation but failed in a production context the developer did not know about. An unusual customer configuration. An unexpected data shape. A feature flag state that had never been tested in combination with another flag. A downstream integration parsing payloads with assumptions that predated the current API version.
The remaining 23% were timing and ordering issues: cases where the code's behavior was correct but its interaction with concurrent processes, cache states, or deployment sequencing created a transient failure.
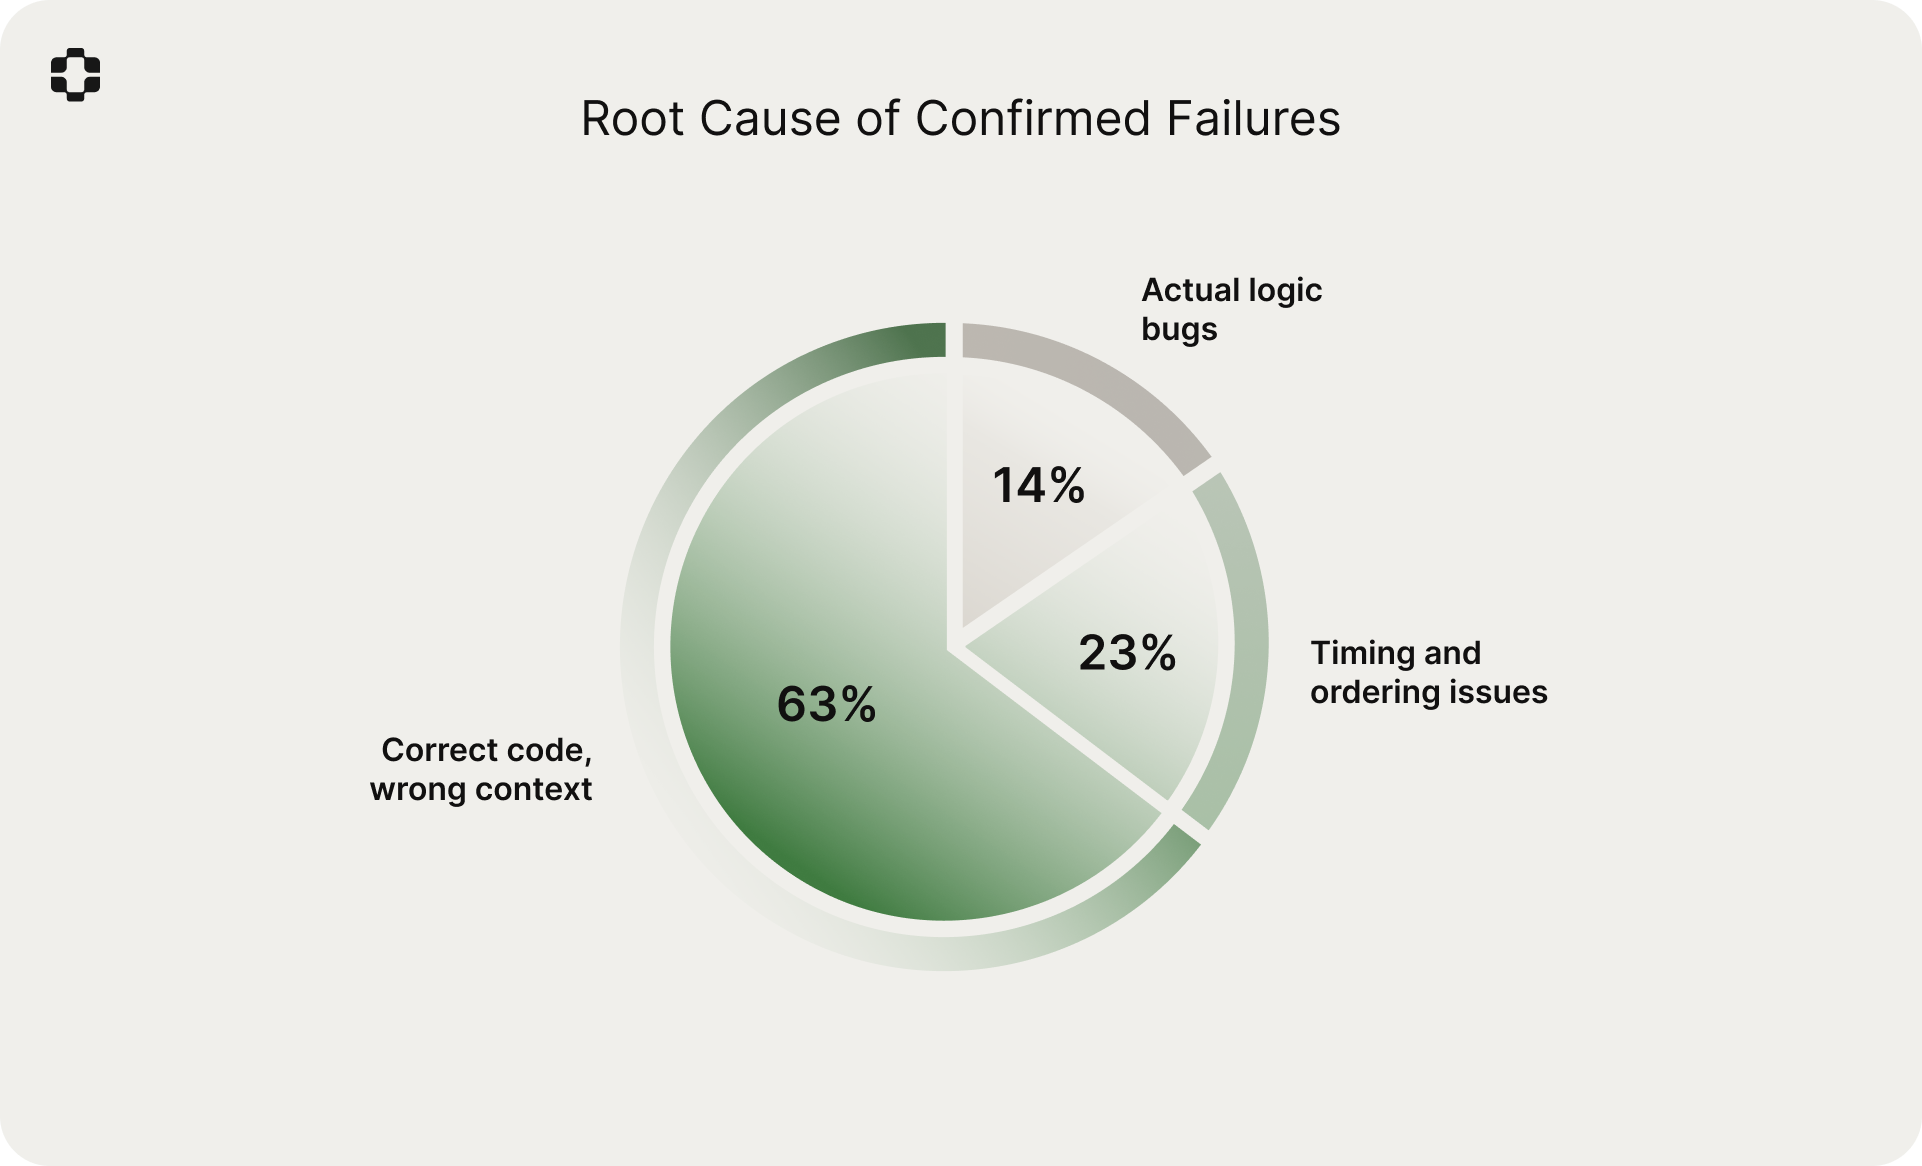
This distribution is, in our view, the most important observation in the study. It explains why code review tools have low confirmation rates against production tickets. They are evaluating code correctness. The dominant failure mode is not incorrect code. It is correct code colliding with production context that exists nowhere in the diff.
Limitations
Several limitations are worth noting.
The confirmation rate measures scenarios that failed in simulation and later became tickets. Some failed simulations may represent real issues that customers did not report, either because they worked around the problem or because the affected workflow was low-traffic. The true positive rate may be higher than 64%, but we cannot measure what customers do not report.
Conversely, some ticket matches may be coincidental rather than strictly causal. Our attribution methodology (automated root-cause analysis validated by manual review on a 15% sample) reduces but does not eliminate this risk.
The system performs better in areas of the codebase with rich ticket history and is less accurate on entirely new features with no production precedent. The compounding accuracy finding (71% for mature deployments vs. 54% for first-month deployments) quantifies this limitation directly.
The 36% of failed simulations that did not result in tickets within 30 days are a mix of true false positives, issues that manifested outside the 30-day window, and issues that were real but unreported. We are working to better characterize this population.
The comparison with code review tools should be read carefully. These tools provide real value for code quality, catching classes of issues that PlayerZero does not focus on. The finding is that they operate on fundamentally different information, and as a result, they surface different categories of problems. The 9% overlap suggests these approaches are largely complementary.
Finally, the sample, while large, is concentrated in B2B SaaS. We expect the patterns to generalize to other domains with complex production environments, but we have not yet verified this.
What this suggests
The central observation from this study is that the information needed to predict production failures is largely absent from the artifacts that current development workflows evaluate: diffs, tests, and code review. The 78% of ticket-generating PRs that passed all checks, the 83% of confirmed failures missed by AI code review tools, and the 9% overlap between code review findings and production-facing failures all point in the same direction. The gap is not in analysis quality. It is in information access.
Production-aware simulation addresses this gap by bringing production context into the development workflow at the point where it can still change the outcome. The 64% confirmation rate, and its improvement to 71% with accumulated history, suggests that the production world model captures meaningful structure about how systems actually fail in the real world.
The Sim-1 simulation engine, which has now processed over 750,000 production simulations since its initial publication, continues to be the foundation of this work. The pre-merge prediction task described here is one application of the broader production world model. The same graph that predicts which PRs will create tickets also powers root-cause investigation when tickets arrive, guides scenario selection for QA, and accelerates triage during incidents. These are different surfaces of the same underlying production understanding.
We plan to publish follow-up work examining the false positive population in more detail, extending the outcome window beyond 30 days, and measuring the system's performance on net-new feature development where historical ticket data is sparse.
Request access at playerzero.ai/get-started.