How to Accelerate Root Cause Analysis with AI Tools
Most production incidents don’t take long to fix. They take a long time to understand.
An alert fires. A support ticket appears. Something in production stops working the way it should. Before engineers can fix the issue, they first have to answer a much harder question: what actually caused it? In other words, what’s the root cause?
In modern distributed systems, that investigation often means jumping between multiple tools and teams just to piece together the full story.
The faster teams can move from symptom to root cause, the faster they can resolve issues and maintain reliable software.
This guide shows how engineering teams cut investigation time by connecting the signals that most teams still manage in isolation.
Why RCA stalls in modern engineering teams
Root cause analysis slows down because engineers have to reconstruct incidents across tools that were never designed to work together as a single investigation workflow.
When an issue appears in production, the investigation typically moves across several disconnected systems—each one revealing only part of the story:
- Monitoring alerts and support tickets identify that something is wrong, but not why
- Observability dashboards and logs surface infrastructure health and recorded events, but without user or session context
- Code repositories and deployment histories show what changed, but not which change caused the failure
- AI-generated code means more changes are being merged faster, often without the commit context that makes manual correlation possible
- Support tickets describe what the customer experienced, but rarely with enough technical detail to reproduce it
Engineers are left manually stitching these signals together to understand what actually happened.
Reproducing customer-reported issues makes this especially difficult. Traditional observability tools can detect issues, but they rarely explain why the system behaved the way it did. Engineers lack visibility into the exact production conditions—user actions, network requests, application state, and deployed code—that triggered the failure. As a result, investigations stretch into days as teams search logs, request more information, and wait for issues to recur.
What engineers ultimately need is not more alerts or more telemetry, but investigation context—a way to connect production behavior, operational signals, and code changes so they can move directly from symptom to root cause.
Four ways to accelerate root cause analysis with AI
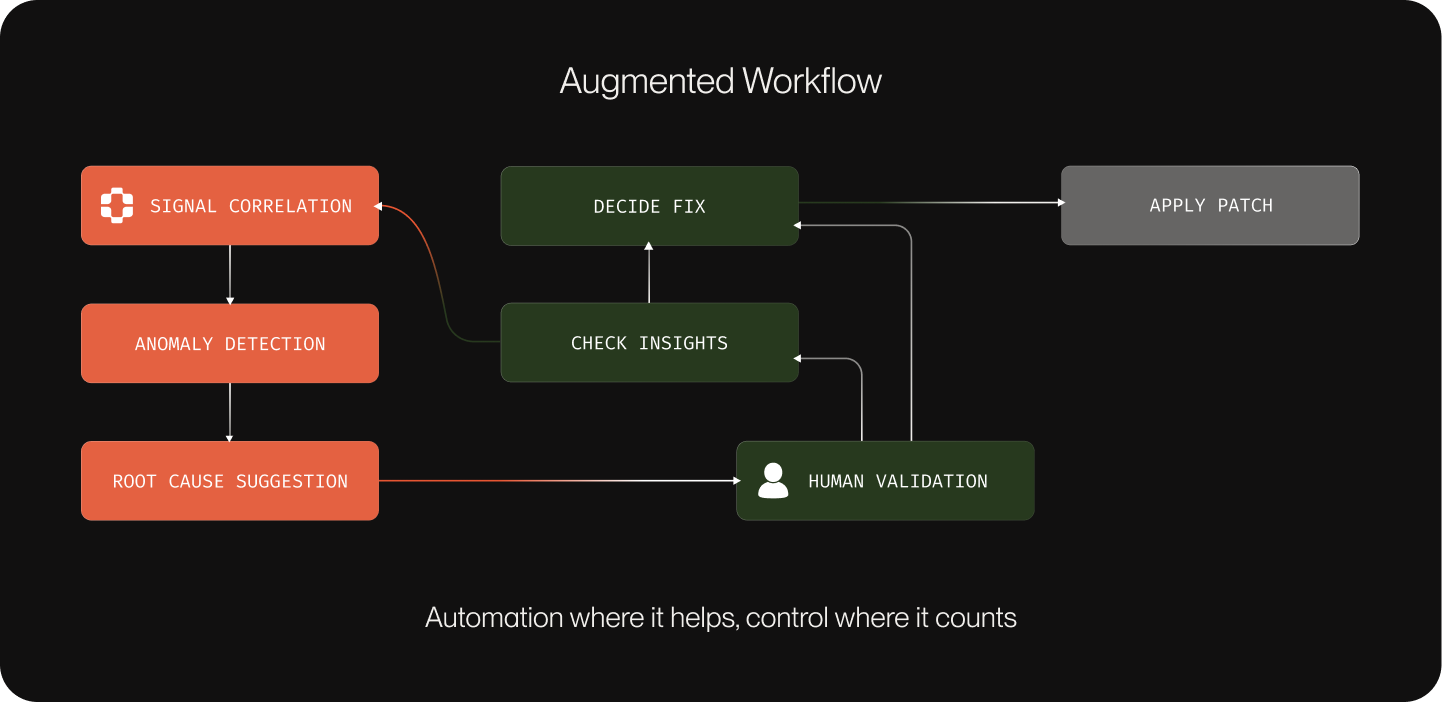
The teams that resolve incidents fastest share one approach: they treat these signals as a single investigation surface, not separate tools. Here's how engineering teams put that into practice.
Step 1: Capture full production context when incidents occur
Customer-reported issues are difficult to diagnose when engineers have no visibility into the exact production conditions under which the failure occurred. Support tickets provide limited detail, leaving teams without enough context to reproduce it.
For example, a customer might report that a checkout flow fails after submitting payment information. When the issue reaches engineering, the team often has no record of the exact sequence of actions that led to the failure. There may be no visibility into the network requests triggered during the session, the console errors that appeared in the browser, or the exact state of the application at the moment the problem occurred.
The most effective way to remove this friction is to capture the full execution context at the moment the issue occurs:
- Capture user interactions, network requests, console logs, and system responses at the moment of failure
- Reconstruct incidents using session replay to observe the exact sequence of events leading to the issue
- Attach session-level context directly to support tickets so engineers can begin investigating immediately
When this context is linked directly to the support ticket, engineers can begin investigating immediately instead of spending hours attempting to recreate the issue. With full visibility into production behavior, engineers can reproduce and diagnose issues without guesswork, immediately seeing the conditions that caused the failure.
At Key Data, engineers connected session replay directly to their support workflow, recreating production issues exactly as they occurred. This reduced issue replication time from weeks to minutes.
Step 2: Connect incidents to the code changes that caused them
Even after understanding how an issue occurred, identifying which code change introduced the failure is difficult in complex environments with multiple services, deployments, and configurations. Most organizations operate a mix of monoliths and microservices, often deployed across multi-tenant infrastructure with customer-specific configurations.
A production failure might be triggered by a configuration change for a specific customer, a dependency update in one service, or an interaction between two systems that were deployed independently. In this environment, manually tracing an incident back to the responsible code often means reviewing deployment timelines, commit histories, and pull requests across several repositories. This process can take hours—or even days—and still may not reveal the true root cause.
The most direct way to shorten this process is to connect incidents to the code changes that introduced new behavior:
- Link incidents directly to recent deployments, commits, and pull requests
- Identify which code changes intersect with the systems involved in the failure
- Use AI analysis to surface high-risk changes across authentication flows, data handling, and service dependencies
Connecting incidents directly to code changes removes the need for manual correlation across repositories and deployment timelines. Engineers can quickly isolate the source of a failure and determine whether it stems from a defect or a configuration issue. PlayerZero automates this correlation, linking production failures directly to the deployments and pull requests that introduced them.
At Zuora, connecting production incidents directly to deployments and pull requests reduced L3 escalations by 60%, enabling support teams to resolve issues in minutes without engineering involvement.
Step 3: Accelerate investigation with AI-assisted debugging
Traditional debugging workflows often require engineers to manually reconstruct system behavior across multiple tools before they can even begin investigating the underlying cause.
Consider a common scenario. Support surfaces a vague ticket: a customer’s dashboard is displaying incorrect data. The engineer checks infrastructure metrics in Datadog, but everything appears healthy. They review Sentry, where an exception appears in the logs, but the error lacks enough user context to determine what triggered it.
They scan recent deployments and find several pull requests merged in the past 24 hours, but without knowing which service, code path, or user condition triggered the failure, the investigation stalls. Support reaches out to the frustrated customer for additional details. Engineers attempt to reproduce the issue locally, but progress is slow.
In many organizations, this process takes three to six days and consumes 12 to 15 hours of engineering time.
AI-assisted debugging accelerates this process by analyzing incidents across the full system context:
- Use an AI investigation agent to analyze incidents across logs, telemetry, session data, and code
- Trace service dependencies to understand how system components interacted during the failure
- Surface the most likely root cause based on execution paths and system signals
- Highlight the specific code paths and interactions responsible for the issue
Rather than starting with a blank slate, engineers begin with a prioritized explanation of what likely happened. This allows teams to move directly from symptom to root cause without reconstructing the system state from scratch.
For example, PlayerZero can identify issues such as a race condition between authentication token generation and a session cache write, reducing investigation time from 3–6 days to 15–30 minutes.
Step 4: Turn root cause analysis into a repeatable team capability
The fastest teams treat investigation context as an asset that should be preserved and reused. But that context is often lost after incidents are resolved, forcing teams to repeat the same debugging work and rely on a small group of experienced engineers.
Engineers may share findings in Slack threads, internal tickets, or postmortem documents, but those insights rarely become part of a reusable investigation workflow. When a similar issue occurs later, the team often starts from scratch.
Over time, this pattern creates bottlenecks. Senior engineers who have experienced past incidents become the only people capable of resolving complex issues quickly, while newer team members struggle to understand the system's historical failure patterns.
Teams that accelerate root cause analysis preserve investigation context and reuse debugging knowledge across incidents:
- Capture failure patterns, root cause code locations, and triggering conditions for each incident
- Document the resolution approach and link it to the associated code change
- Convert resolved issues into test scenarios built from the exact production conditions that triggered the failure
- Make investigation context accessible across engineering, QA, and support teams
When investigation context becomes shared and reusable, teams resolve issues faster and reduce repeated debugging work. PlayerZero captures this context automatically, linking failure patterns, root cause locations, and resolution approaches to each incident so teams can reference and reuse them when similar issues appear in the future. Support teams can handle more incidents independently, while engineers focus on higher-impact work.
Cayuse connected incident investigations to a shared triage workflow, achieving an 80% reduction in time to resolution. Cyrano Video reduced engineering hours spent on debugging efforts by 80% and enabled Customer Success teams to resolve 40% of issues without escalation.
Accelerate root cause analysis with a unified investigation workflow
Teams that accelerate root cause analysis treat production behavior, operational signals, code changes, and past incidents as a single investigation surface—not four separate tool silos.
PlayerZero brings these signals together by linking session replay, system telemetry, pull requests, and historical debugging insights into a unified investigation workflow—so engineers can move from symptom to root cause without hours of manual reconstruction.
Book a demo to see how PlayerZero accelerates root cause analysis across your entire engineering workflow.